 $6.99
$6.99
Home › Templates › Finance › Ledgerline
Finance dashboard template
Ledgerline Treasury Dashboard Template
Ledgerline is a single-file HTML dashboard for a company finance office: weekly cash, receivables, payables, P&L versus budget, and a 13-week forecast.
Ledgerline is a treasury and finance operations dashboard template for an operating company. It is one self-contained HTML file styled like an annual report, with five tabs, Cash, Receivables, Payables, P&L, and Forecast, rendering the books of the fictional Arden Supply Co. for week 27, with the June close at day 3 of 5 and a Print week pack action in the masthead.
Ledgerline's Cash tab opens with a waterfall from a $1,412,600 opening balance through collections, payroll, inventory, rent, debt service, and tax to a $1,185,350 projected close. Beside it, a 13-week runway strip flags the 3 weeks that dip below the $950K minimum cash floor, bottoming at $861K in week 33, and four bank accounts carry reconciliation stamps. Receivables shows $1,115,300 of AR against a 39-day DSO, an aging ladder in 5 buckets, a 12-month DSO trend down from a 47-day December peak, and a top-5 debtor table with promise-to-pay dates and send-statement actions. Payables lists three Wednesday payment runs with approve buttons that stamp the run PAID, an AP aging ladder, and early-payment discounts worth $2,887 with take-by dates. The P&L tab compares June actual to budget on 10 lines through a $125.2K EBITDA, with favorable variances in green and unfavorable in orange, plus a gross margin bridge in basis points. Forecast offers Base, Tight, and Stretch scenarios, per-scenario assumption cards for hiring, capex, and collections, and covenant headroom meters for the bank facility.
What is inside Ledgerline
- Cash waterfall from a $1,412,600 opening balance through 6 flow lines to a $1,185,350 projected close, with hover tooltips and draw-in animation
- 13-week runway strip with a dashed $950K minimum cash floor and below-floor weeks flagged in orange
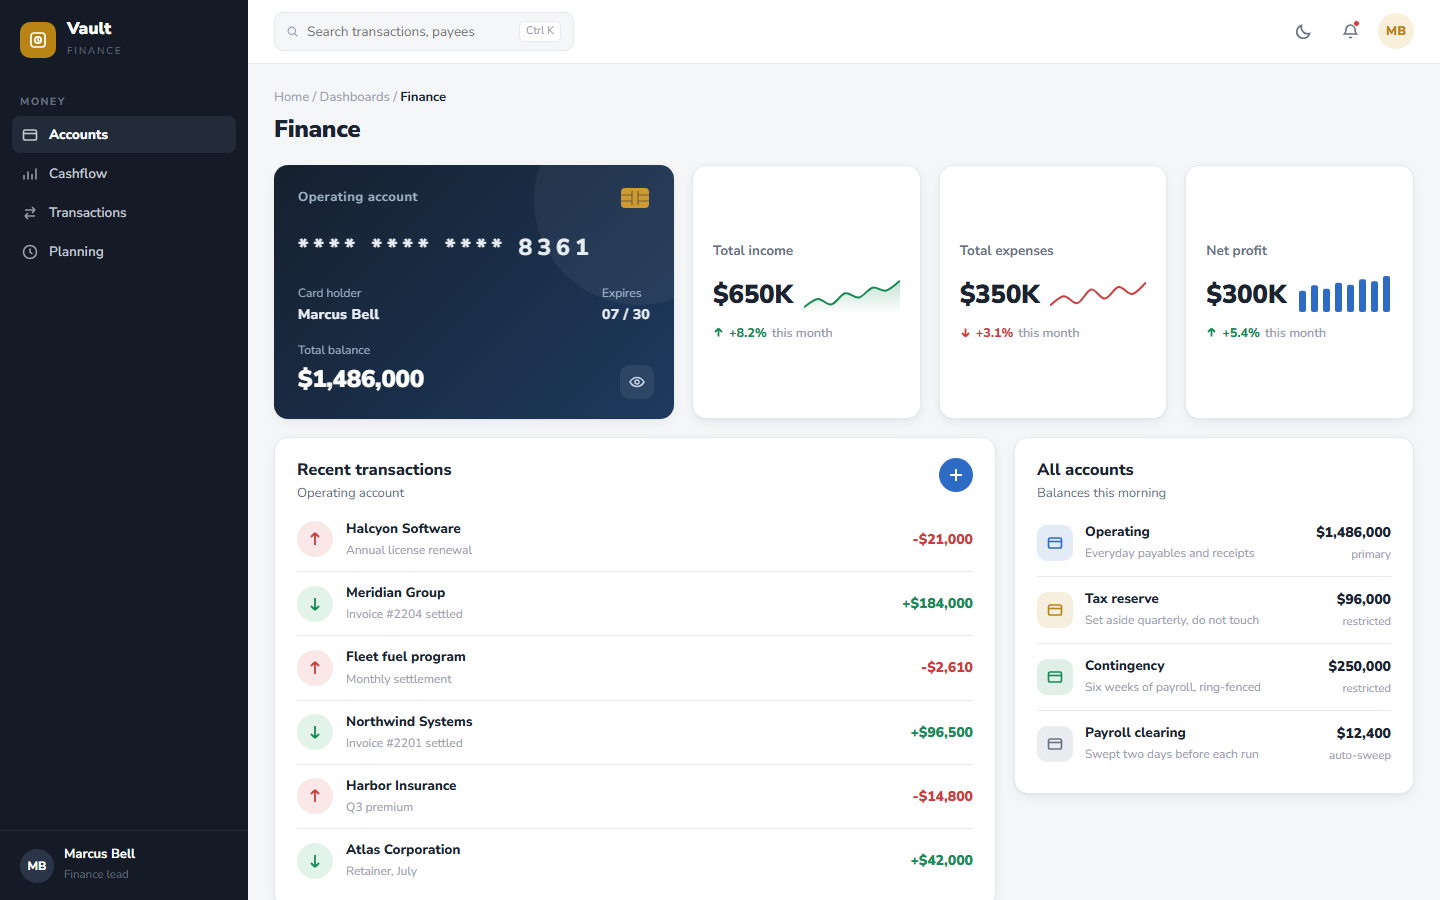
- Four bank accounts with balances and reconciliation status stamps
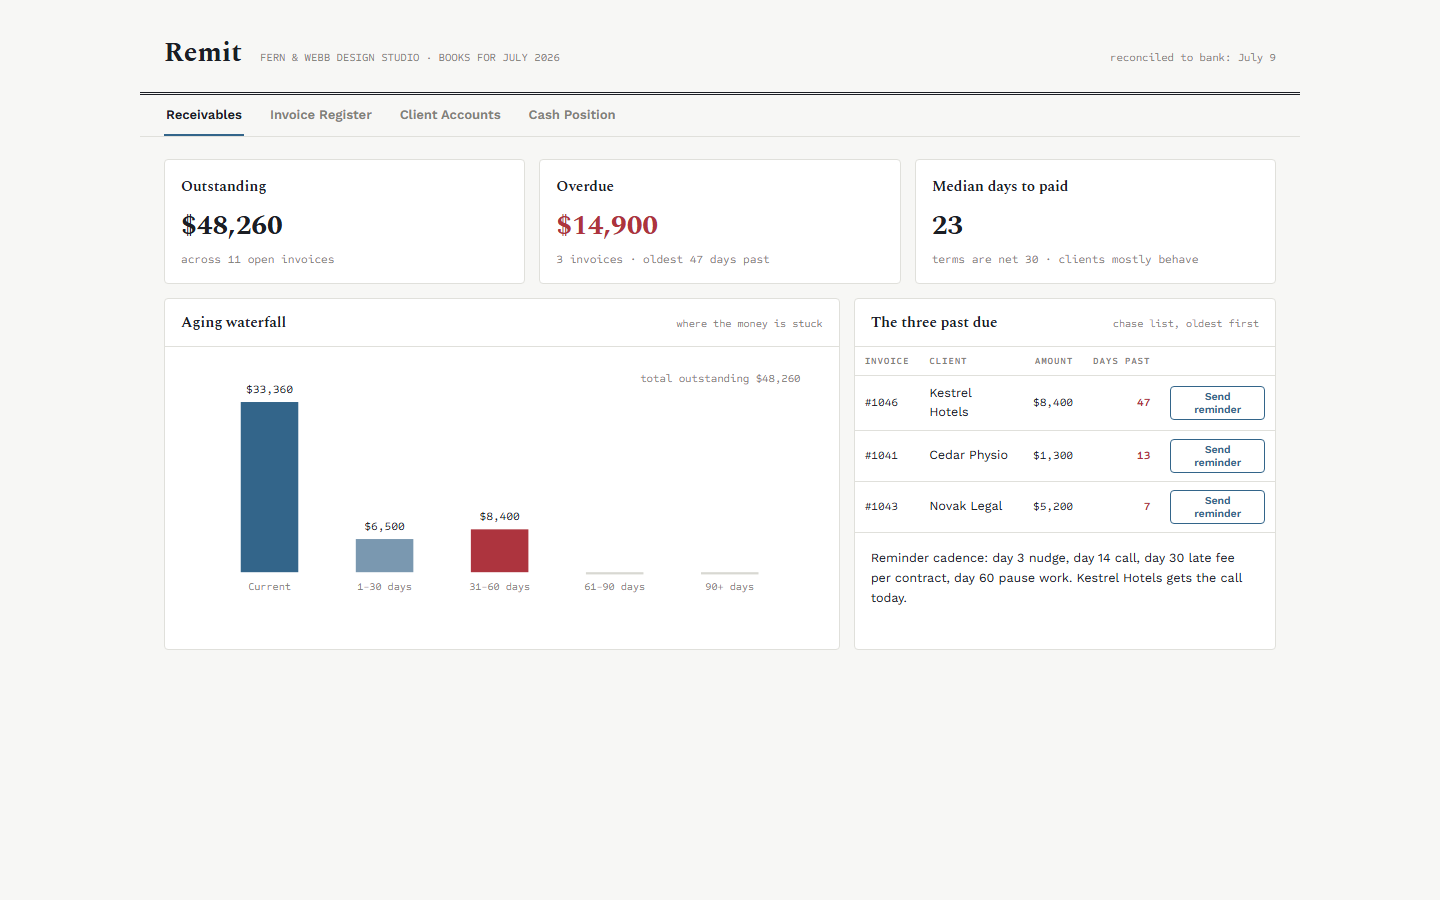
- AR aging ladder across 5 buckets with weekly collected, billed, and promised figures
- DSO trend line over 12 months, from a 47-day December peak down to 39 days
- Top 5 debtor table with promise-to-pay dates and send-statement actions
- Three upcoming payment runs with per-vendor lines, run totals, and approve buttons that stamp the run PAID
- Early-payment discount list totaling $2,887 with take-by dates
- Monthly P&L versus budget with dollar and percent variance on 10 lines through $125.2K EBITDA
- 13-week forecast with Base, Tight, and Stretch scenarios, assumption cards, and 3 covenant headroom meters
Who Ledgerline is for
Ledgerline serves controllers, who run the Monday cash meeting from the Cash tab: the waterfall explains the week's movement and the runway strip shows when the floor gets tested.
Treasury managers watch the 13-week forecast, switching between Base, Tight, and Stretch to time hiring and capex, like the $62,000 forklift deferred in the Tight case.
AR and AP leads work the aging ladders, promise-to-pay dates, and the early-payment discount list, which quantifies the return on paying inside terms.
CFOs read the P&L variance table and covenant meters, confirming fixed charge coverage of 1.86x against the 1.25x minimum before the quarterly bank test.
When to reach for it
Ledgerline fits a company whose 13-week cash forecast lives in a spreadsheet that only one person understands. The template fixes the layout: weekly balances go into labeled arrays, and the floor line, scenario switch, and assumption cards render the same way every week.
It fits the month-end close cycle. The P&L variance table and gross margin bridge answer the two questions every review meeting asks, what moved against budget and why margin changed, without rebuilding charts.
Companies with a bank facility pick it for covenant visibility. The three meters show current values, covenant limits, and headroom side by side, so the September 30 test is a known quantity months ahead.
Specifications
| Format | Single self-contained HTML file; zero dependencies, no build step |
|---|---|
| Theme | Annual Report |
| Mood | Light |
| Category | Finance |
| Price | $6.99, one-time |
Frequently asked questions
What is the 13-week forecast based on?
The 13-week forecast is based on a weekly cash projection built from the same model as the runway strip. Each scenario is a labeled array of 13 weekly balances plus text assumptions for hiring, capex, and collections. Swap the arrays for your own and the chart, floor flags, and notes follow.
Can I print a weekly pack for a meeting?
Yes, you can print a weekly pack: the masthead has a Print week pack button that demonstrates the workflow with a confirmation toast. The page is a normal HTML document, so browser printing works, and the high-contrast ink styling holds up in black and white.
Does the P&L handle variance signs correctly for cost lines?
Yes, the P&L handles variance signs correctly for cost lines: the table flips the sign convention on cost rows, so favorable is green and unfavorable is orange whether the line is revenue or expense. Subtotal rows carry heavier rules in the annual report style.
What size of company does this fit?
Ledgerline fits a company of the sample company's size: about $1.5M of monthly revenue, four bank accounts, and a covenant-lite bank facility. That scale, roughly a 20 to 100 person operating business, is where weekly cash discipline matters and a full FP&A platform is overkill.