 $6.99
$6.99
Home › Templates › Admin › Aegis
Admin dashboard template
Aegis Security Operations Dashboard Template
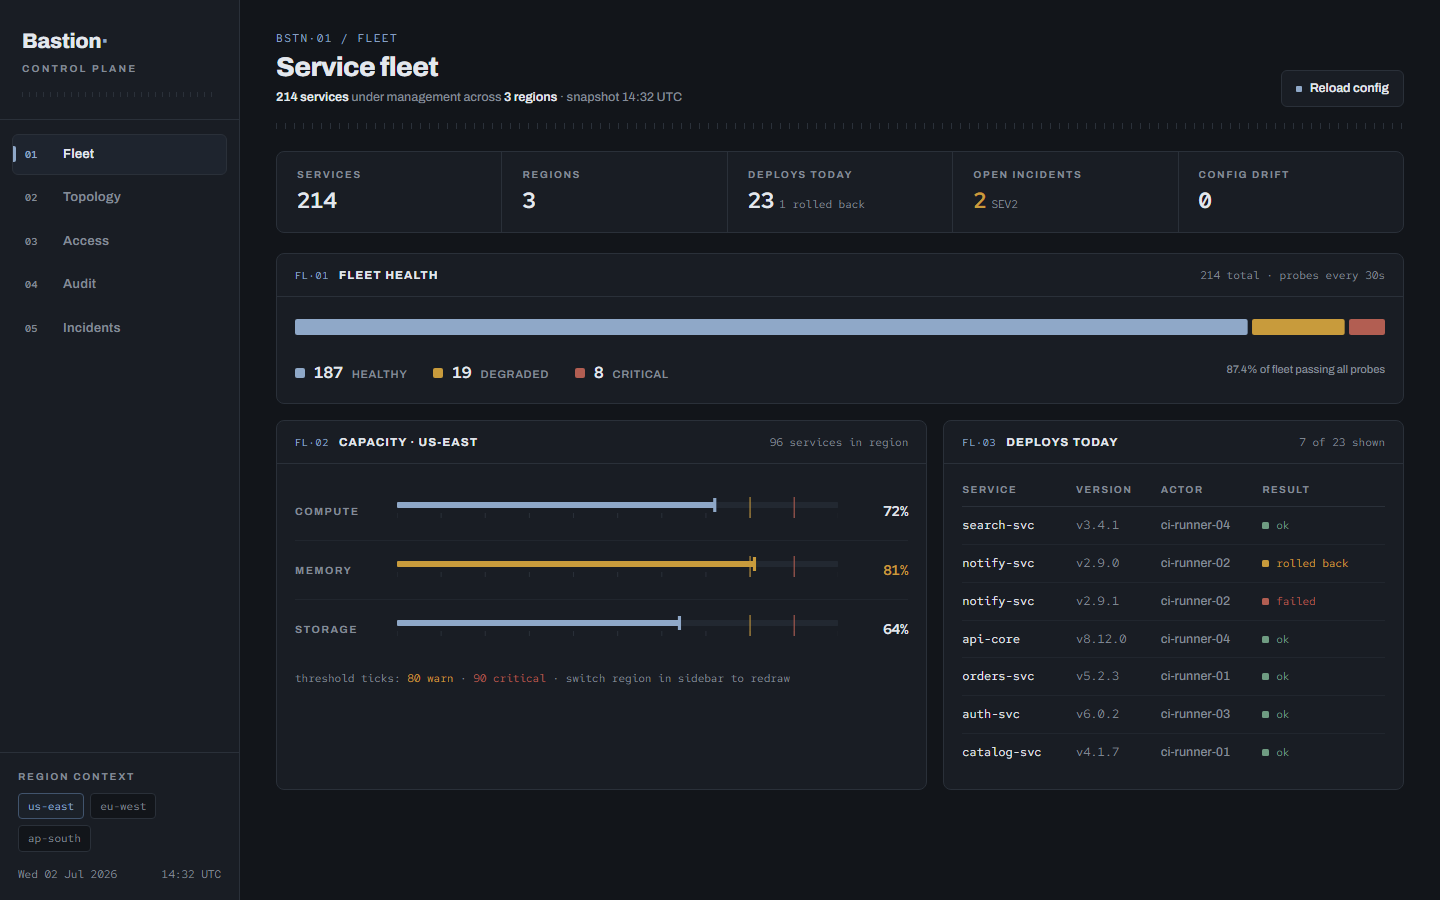
Aegis is a single-file HTML dashboard template for a SOC, with alert triage, an incident room, attack surface, threat intel, and compliance views.
Aegis is a security operations dashboard template built as one self-contained HTML file. A security operations dashboard shows the state of a SOC: open alerts, response times, active incidents, exposure, and audit readiness. Aegis renders all five of those as separate views behind a numbered sidebar, in a dark Machined Steel theme with the steel blue accent #93A7C4. The file opens in any browser and needs no build step, framework, or backend.
Aegis opens on the Alert Triage view, which leads with four KPI cards: Open alerts at 14 against a 24 hour baseline of 11, Median time to ack at 6.2 minutes against a 15 minute SLA, a False positive rate of 31% against a target under 35%, and 126 alerts auto-triaged overnight. Below the cards, alerts sit in Critical, High, and Medium severity lanes, each carrying a rule name, an affected asset, a MITRE ATT&CK technique code like T1003.001, an age, and an analyst initial. Selecting an alert opens a detail panel with a minute-by-minute timeline, related entities, and an acknowledge button that clears the card from the lane. The Incident Room view reconstructs three active incidents on a five-stage attack chain from Initial access to Exfil attempt, marking each stage observed, blocked, or not seen, with a phase stepper running Detect, Contain, Eradicate, Recover. The Attack Surface view tracks patch compliance by ring against a 95% target, an internet-facing services table with findings like TLS 1.1 still enabled, an MFA coverage donut at 97.4% across 4,020 identities, and open cloud misconfigurations per account. Threat Intel adds an actor watchlist, a filterable IOC feed, and a sector threat level gauge. The Compliance view frames everything for a SOC 2 Type II audit with a control framework board, an exception register, and an auditor request queue.
What is inside Aegis
- Alert Triage view with 4 KPI cards: Open alerts, Median time to ack, False positive rate, Auto-triaged tonight
- Critical, High, and Medium severity lanes with filter chips and per-lane open counts
- Alert detail panel showing a timestamped timeline, related entities, and an acknowledge action with toast confirmation
- Incident Room with a 5-stage attack chain diagram marking each stage observed, blocked, or not seen
- Phase stepper for Detect, Contain, Eradicate, Recover on each of the 3 sample incidents
- Patch compliance bars for Servers, Workstations, and Mobile rings with a tick mark at the 95% target
- Internet-facing services table with Service, Port, Ring, Last scan, and Finding columns
- MFA coverage donut at 97.4% plus identity hygiene counters for dormant admins, privileged sessions, and stale OAuth grants
- Threat intel view with an actor watchlist, TTP profile, IOC feed filterable by hash, domain, or IP, and a 4-level sector threat gauge
- SOC 2 compliance board with 5 control domains, stale and failing filters, an exception register, and an auditor request queue
Who Aegis is for
Aegis serves the SOC analysts who work the Alert Triage lanes, filter by severity, acknowledge alerts, and check the auto-triage note when recurring false positives get suppressed. Incident responders run the Incident Room: they walk the attack chain stage by stage, read the evidence attached to each node, and record containment actions in the ledger with time, action, and owner. Security engineers watch the Attack Surface view to see which patch ring is slipping below the 95% target and which internet-facing service carries an open finding. A security lead or CISO reads the Threat Intel view for actor relevance and the sector threat level, then uses the Compliance view to see which SOC 2 domains are passing, stale, or failing before fieldwork opens. IT security managers use the exception register to track what expires and when.
When to reach for it
Aegis is the pick when you need a SOC console layout and you do not want to spend a sprint designing one. The triage queue, the attack chain, and the compliance board are already drawn; you replace the inline JavaScript data arrays with your own alerts, incidents, and controls. It fits a security team that currently pastes alert counts into a weekly slide deck, a startup building its first SOC 2 evidence tracker, or a consultant mocking up a SOC workflow for a client before the real SIEM connector exists. The sample data models a mid-size environment: 4,200 endpoints, 38 SaaS apps, 3 clouds, so the density of every panel is realistic at that scale. Because every view is plain HTML, CSS, and inline SVG, a developer can retune the severity colors or swap the Red Hat Mono typeface in minutes. Aegis replaces the spreadsheet that tracks patch rings, the slide that lists open incidents, and the shared doc that holds the auditor request queue.
Specifications
| Format | Single self-contained HTML file; zero dependencies, no build step |
|---|---|
| Theme | Machined Steel |
| Mood | Dark |
| Category | Admin |
| Price | $6.99, one-time |
Frequently asked questions
What does the Aegis dashboard template include out of the box?
The Aegis dashboard template includes one HTML file with five views out of the box: Alert Triage, Incident Room, Attack Surface, Threat Intel, and Compliance. Each view renders realistic sample data from inline JavaScript arrays, so you open the file and immediately see working triage lanes, an attack chain diagram, patch rings, and a SOC 2 control board.
Can I connect Aegis to live SIEM data?
Yes, you can connect Aegis to live SIEM data. All panels render from plain JavaScript arrays like ALERTS, INCIDENTS, and DOMAINS near the bottom of the file. Replace those arrays with fetch calls to your API or paste in exported records, and the views redraw without any other change.
Does Aegis show MITRE ATT&CK technique codes?
Yes, Aegis shows MITRE ATT&CK technique codes on every alert. Each alert in the triage lanes carries a technique code such as T1003.001 for credential dumping or T1567.002 for exfiltration to cloud storage. The code appears under the rule name on each alert card and in the alert detail panel.
Is Aegis a dark theme template?
Yes, Aegis is a dark theme template. The Machined Steel dark theme pairs a #101318 background with #171B22 panels and a #93A7C4 steel blue accent. Severity colors for critical, high, medium, and low are defined as CSS variables, so recoloring them takes one edit at the top of the file.
Related templates
$6.99
 $6.99
New
$6.99
New
Summit
$6.99 $6.99
$6.99
Nimbus Admin
$6.99 $6.99
$6.99
Tranche
$6.99 $6.99
$6.99
Trunkline
$6.99 $6.99
$6.99