 $6.99
$6.99
Home › Templates › Admin › Bastion
Admin dashboard template
Bastion Infrastructure Admin Dashboard Template
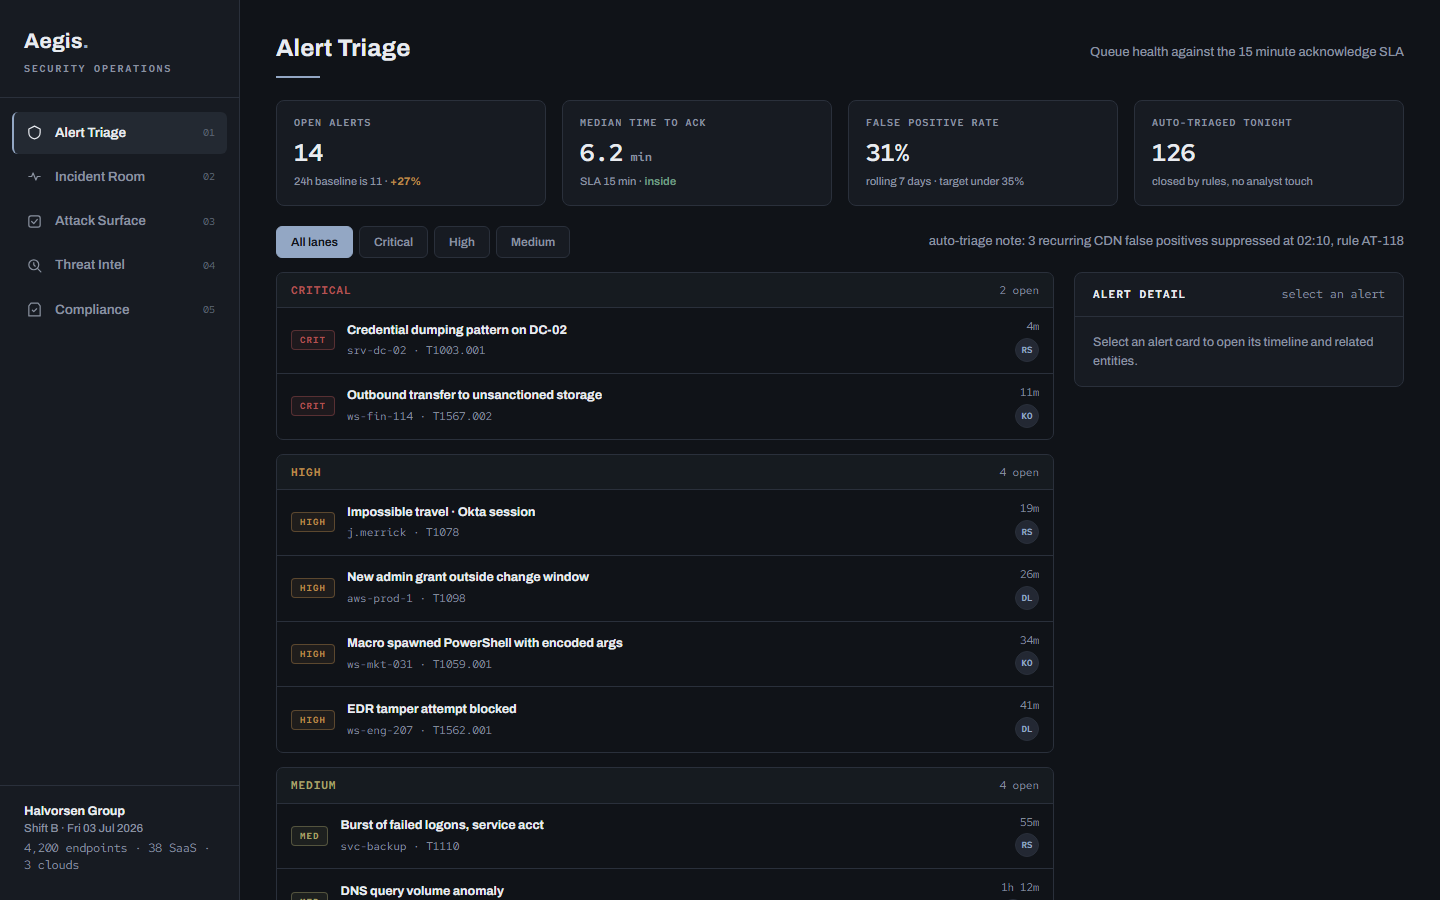
Bastion is a single-file HTML admin dashboard template for an infrastructure control plane, covering fleet health, service topology, RBAC, audit, and incidents.
Bastion is an admin dashboard template for infrastructure operations, delivered as one self-contained HTML file. An infrastructure admin dashboard shows the health and governance of a service fleet: how many services pass their probes, who holds which permissions, what changed in the audit log, and how fast incidents get resolved. Bastion renders all of that across five numbered views in a dark Gunmetal theme with the steel accent #8FA8C8, using Archivo for text and Red Hat Mono for figures.
Bastion opens on the Fleet view with a spec strip of five figures: 214 services, 3 regions, 23 deploys today with 1 rolled back, 2 open SEV2 incidents, and 0 config drift. A fleet health bar splits 214 services into 187 healthy, 19 degraded, and 8 critical, and capacity gauges for compute, memory, and storage redraw when you switch the region chip between us-east, eu-west, and ap-south, with warn and critical ticks at 80 and 90 percent. The Topology view draws a dependency map of 12 core services where edge weight scales with call volume and degraded nodes tint amber; clicking a node opens a service card with owner team, SLO target, one-hour error rate, and upstream and downstream neighbors. Access shows a full RBAC matrix of 6 roles against 7 permission groups, the 3 privileged sessions currently open, and a grants ledger where every grant lists an actor and a second approver. Audit renders an events-per-hour strip for the last 24 hours, 641 events with a 17:00 peak, above a filterable event ledger with time, category, actor, action, target, and source IP. Incidents closes the set with a 14-day severity lane timeline, MTTR by severity, the on-call rota, and postmortem status.
What is inside Bastion
- Fleet view with a 5-figure spec strip: 214 services, 3 regions, 23 deploys, 2 open SEV2 incidents, 0 config drift
- Fleet health proportion bar splitting services into 187 healthy, 19 degraded, and 8 critical
- Capacity gauges for compute, memory, and storage that redraw per region with warn and critical threshold ticks at 80 and 90 percent
- Deploys table with Service, Version, Actor, and Result columns showing ok, rolled back, and failed states
- Interactive dependency map of 12 core services with degraded nodes tinted amber and a click-to-open service detail card
- RBAC matrix of 6 roles against 7 permission groups with full, scoped, and none access marks
- Privileged sessions panel and a recent grants table where every grant lists an actor and a separate approver
- Audit trail with a 24-hour events-per-hour strip and a category-filterable ledger with source IPs
- Incident record with a 14-day severity lane timeline, MTTR by severity (SEV1 2h 30m), on-call rota, and postmortem status list
Who Bastion is for
Bastion serves the platform engineers who live in the Fleet view: they watch probe health, check capacity against the 80 and 90 percent thresholds, and scan the deploys table for rolled back or failed results. SRE leads use the Topology view to see which service is degraded and what breaks downstream, and they own the Incidents view where MTTR by severity and the postmortem queue tell them whether the team is keeping up. Security and compliance staff work the Access and Audit views: the RBAC matrix answers who can touch secrets or billing data, and the event ledger answers who did touch them, with source IPs. An engineering manager reads the spec strip and the incident record before a weekly review, because 214 services, 2 SEV2s, and a SEV1 MTTR of 2h 30m is a complete status in one glance.
When to reach for it
Bastion is the pick when you are building an internal admin console and the hard part is the layout, not the data. An RBAC matrix, a topology map, and a severity timeline each take days to design well; Bastion ships all three working. It suits a platform team replacing a wiki page of on-call schedules and postmortem links, a startup standing up its first operations console before it can justify a commercial observability seat for every engineer, or an agency delivering an admin UI mock that a client can click through. The sample data is internally consistent: the rolled back notify-svc deploy in the Fleet table also appears in the audit ledger and in the postmortem queue, so the template demonstrates how cross-view traceability should feel. Swapping the arrays for live data is a single edit, and the region chips show how a filter control redraws a whole panel.
Specifications
| Format | Single self-contained HTML file; zero dependencies, no build step |
|---|---|
| Theme | Gunmetal |
| Mood | Dark |
| Category | Admin |
| Price | $6.99, one-time |
Frequently asked questions
What views does the Bastion admin dashboard template have?
The Bastion admin dashboard template has five views behind a numbered sidebar: Fleet, Topology, Access, Audit, and Incidents. Fleet covers service health, capacity, and deploys. Topology draws the service dependency map. Access holds the RBAC matrix and grants. Audit is the event log. Incidents tracks timeline, MTTR, on-call, and postmortems.
Does the Bastion template include an RBAC permissions matrix?
Yes, the Bastion template includes an RBAC permissions matrix in its Access view. The matrix maps 6 roles (platform-admin, sre-lead, deployer, developer, auditor, read-only) against 7 permission groups including Secrets and Billing data. Each cell shows full, scoped, or none access with a legend, and the panel header notes the policy revision.
Can the capacity gauges switch regions?
Yes, the capacity gauges can switch regions. Three region chips in the sidebar (us-east, eu-west, ap-south) redraw the compute, memory, and storage gauges from a data object, update the service count note, and fire a confirmation toast. The same pattern works for any filter you wire to your own data.
Is Bastion a single HTML file with no dependencies?
Yes, Bastion is a single HTML file with no dependencies. All charts are inline SVG drawn by the embedded script, fonts load from Google Fonts, and there is no framework, bundler, or backend. You open the file in a browser and every interaction works.
Related templates
$6.99
 $6.99
New
$6.99
New
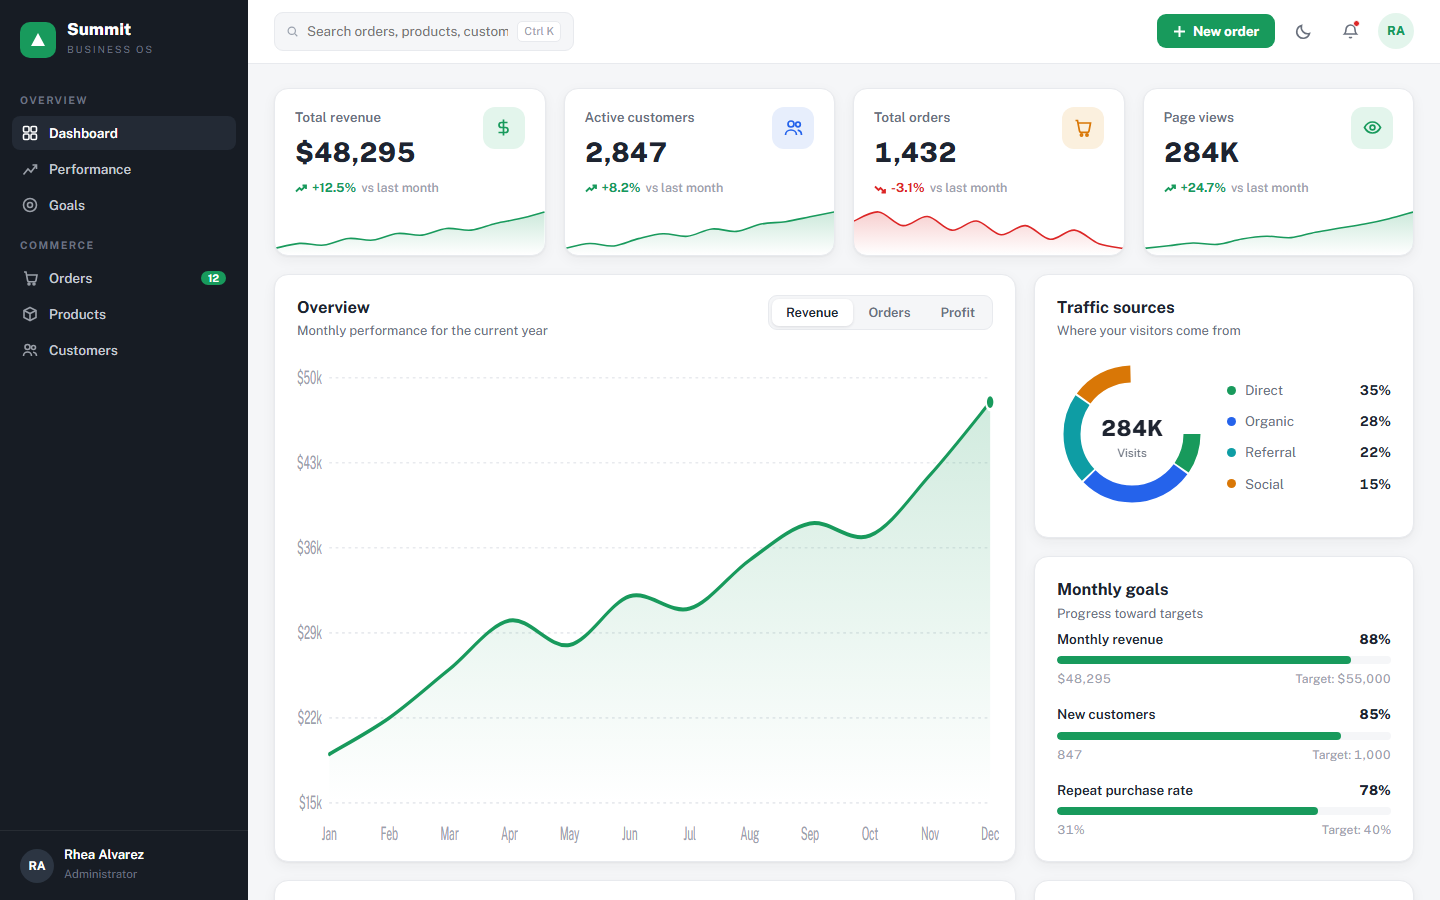
Summit
$6.99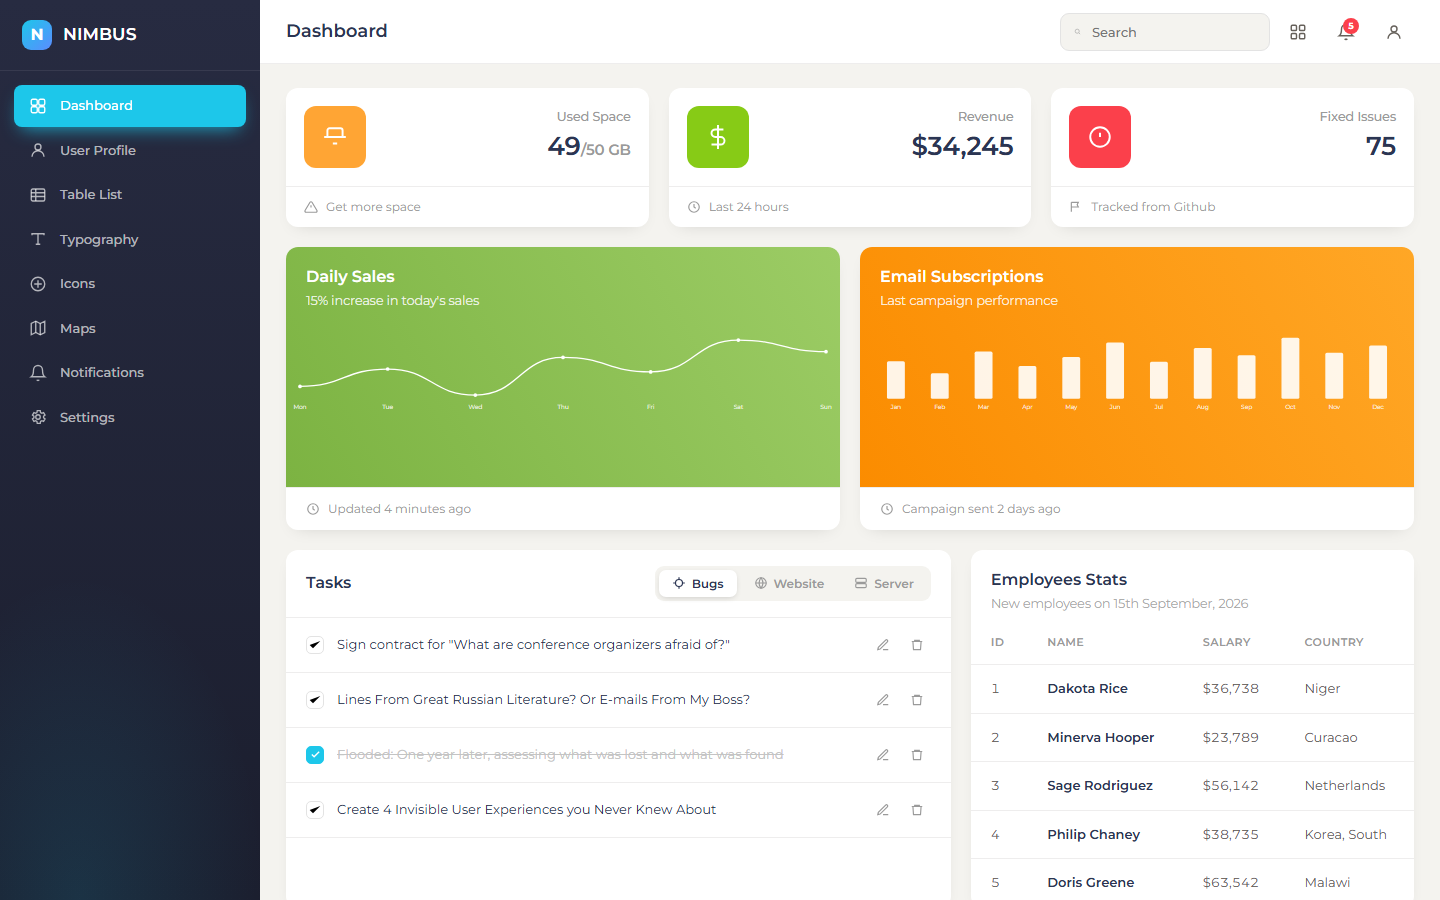 $6.99
$6.99
Nimbus Admin
$6.99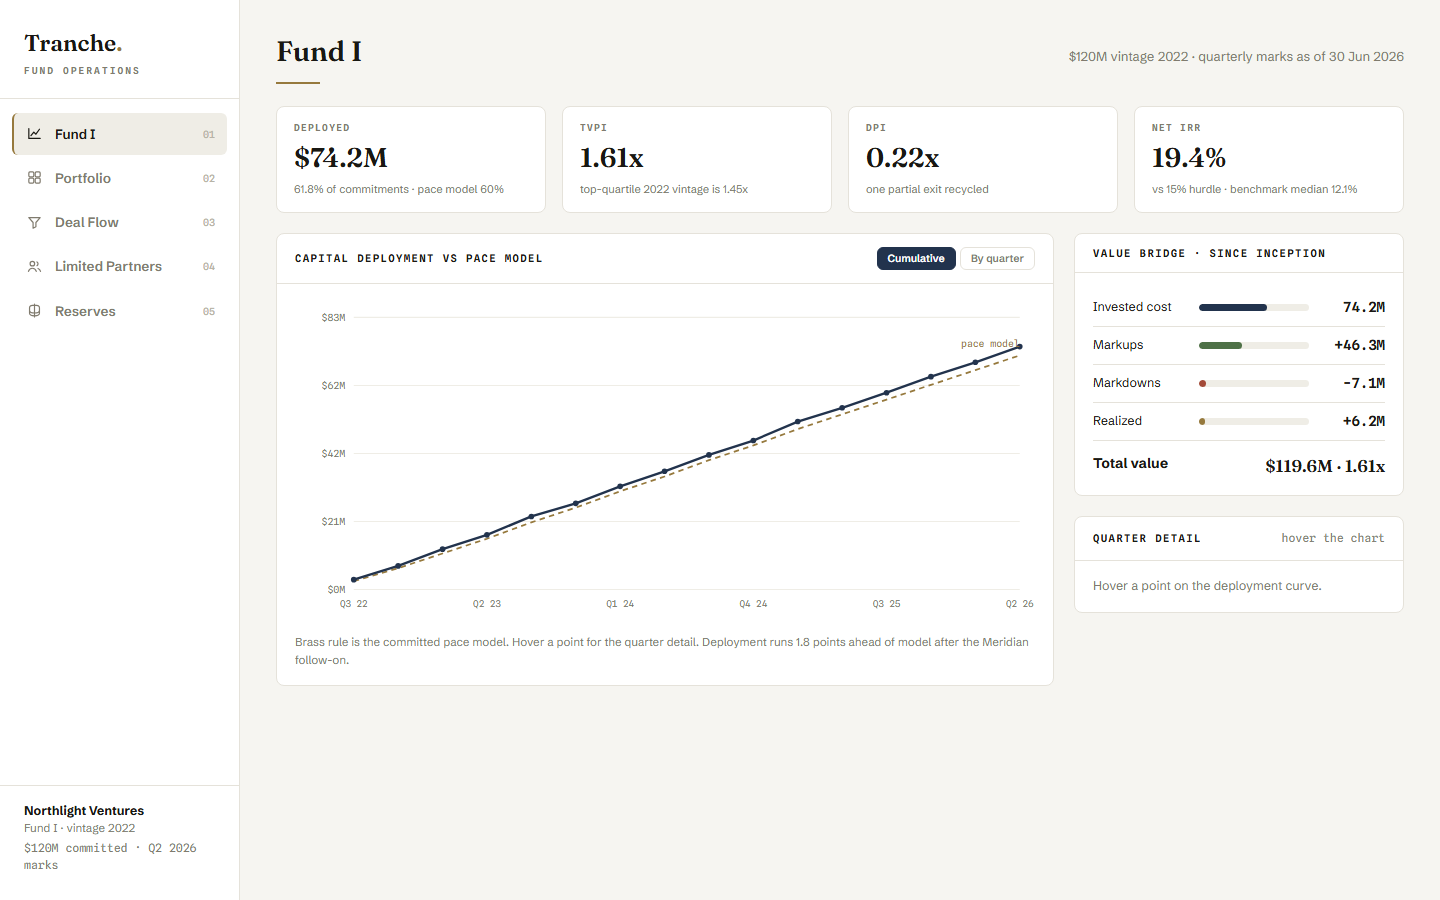 $6.99
$6.99
Tranche
$6.99 $6.99
$6.99
Trunkline
$6.99 $6.99
$6.99