Home › Templates › Projects
Category
Project Management Dashboard Templates
A project management dashboard template is a single HTML file that renders delivery status in a browser. Delivery status includes program health, timelines, capacity, risk, and spend. This page lists 2 project management templates, each a self-contained file you preview live, buy for $6.99, and edit in any text editor.
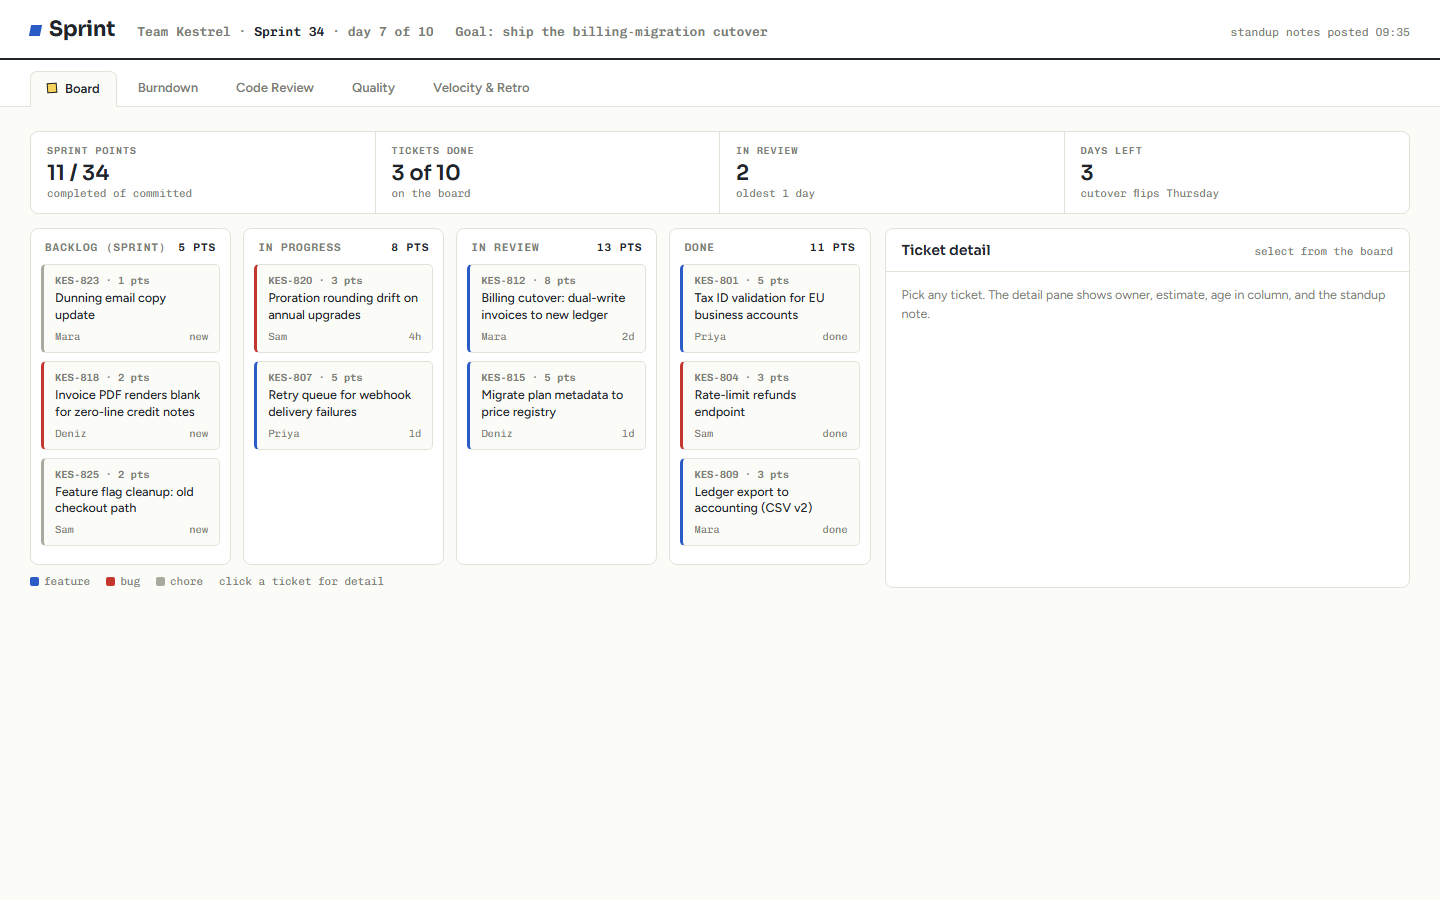
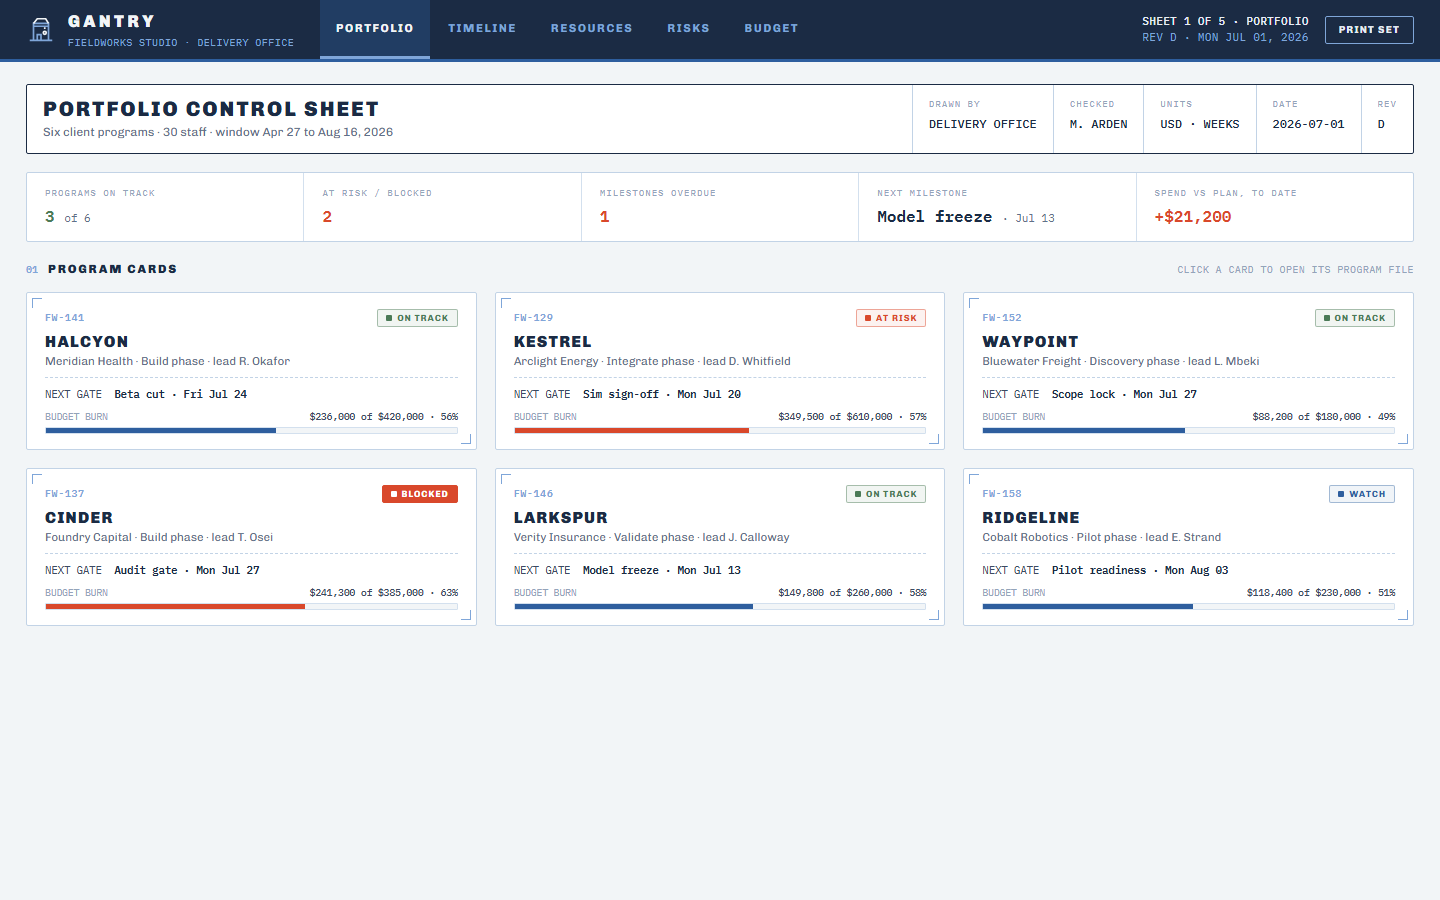
The 2 templates split the work by altitude. Gantry is a portfolio control sheet for a delivery office: 6 client programs, 30 staff, a 16-week Gantt with milestone diamonds, a weekly load heatmap where red means booked over 100%, a 10-item risk register, and a header strip reporting 3 of 6 programs on track with spend at +$21,200 versus plan. Sprint drops to team level: a kanban board, a burndown against the ideal line, a scope ledger recording every change after commitment, a pull request table with a 3.1-hour median review latency against a 4-hour target, and velocity across the last 8 sprints. Both are project management dashboards; they disagree only about how far above the work you stand.
Compare the projects templates
| Template | Domain | Theme | Price |
|---|
| Gantry | Projects, Portfolio | Blueprint | $6.99 |
| Sprint | Software delivery, Agile | Whiteboard Marker | $6.99 |
Who uses these
A project management dashboard serves 5 roles: PMO leads, program managers, resource managers, scrum masters, and engineering managers. PMO leads run the Monday portfolio review from Gantry's header strip and program cards across all 6 programs. Program managers defend dates with the Gantt and the critical path note, where a zero-float chain shows exactly where a slip lands. Resource managers resolve overbooking from the load heatmap, which flags one engineer at 120% for the weeks of Jul 13 and Jul 20. Scrum masters separate a slow sprint from a growing one with Sprint's burndown and scope ledger. Engineering managers clear the two things that stall delivery, unreviewed pull requests and flaky CI, from the Code Review and Quality tabs.
When to reach for one
A project management template is the right pick when the portfolio review runs on a slide deck rebuilt every week. A template replaces that deck with a page where the Gantt, the load heatmap, and the risk register already agree, because all three read the same data. Pick it also when the planning tool's own reporting is the bottleneck: the plan lives in Microsoft Project or Smartsheet, but a $6.99 HTML file is what stakeholders actually read, with no seat license between them and the numbers. Capacity questions connect delivery to staffing, so the category pairs naturally with the HR template; the dashboard versus report guide explains why the dashboard is the right format for the weekly review.
Frequently asked questions
What is a project management dashboard template?
A project management dashboard template is a pre-built HTML page that displays delivery metrics such as program status, timeline, capacity, risk, and spend. You download one file, replace the sample data with your own, and open it in a browser. No server or project tool account is required.
Does a project management template replace Microsoft Project or Smartsheet?
No, a project management template replaces the reporting view, not the planning tool. Gantry shows status, timeline, capacity, risk, and spend on one read-only sheet. You still plan elsewhere, then publish the numbers into the file for stakeholders to read.
Which project management template should I start with?
Gantry is the template to start with if you run more than one project, because it covers the portfolio set: program cards, a 16-week Gantt, a load heatmap, and a risk register. If you run a single agile team, start with Sprint, which covers the board, burndown, pull requests, and velocity.
What agile metrics does Sprint chart?
Sprint charts 5 agile metric groups: points remaining versus ideal, review latency with a 3.1-hour median, flaky test fail rates over 7 days, deploy results with rollbacks marked, and committed versus completed velocity across 8 sprints. Retro actions get a table, not a chart.
 Dashboard
 $6.99
New
Gantry is a single-file HTML dashboard for portfolio control: program cards, a 16-week Gantt, capacity heatmap, risk register, burn rate, and change orders.
header strip with 5 portfolio KPIs: programs on track (3 of 6), at risk or blocked (2), milestones overdue (1), next milestone, and spend vs plan (+$21,200)clickable program cards with Done, In Progress, and Planned states16-week program Gantt with hover for owner, dates, and float, plus clickable milestone diamonds with definition of done
Buy now · $6.99Live preview
$6.99
New
Gantry is a single-file HTML dashboard for portfolio control: program cards, a 16-week Gantt, capacity heatmap, risk register, burn rate, and change orders.
header strip with 5 portfolio KPIs: programs on track (3 of 6), at risk or blocked (2), milestones overdue (1), next milestone, and spend vs plan (+$21,200)clickable program cards with Done, In Progress, and Planned states16-week program Gantt with hover for owner, dates, and float, plus clickable milestone diamonds with definition of done
Buy now · $6.99Live preview