Home › Templates › Logistics
Category
Logistics Dashboard Templates
A logistics dashboard template is a single HTML file that shows whether the network is running to plan. Logistics metrics include on-time performance against target, transit volume, delay minutes by cause, dwell time, and the cost of delay. This page lists 4 logistics templates, each one a self-contained file you preview live, buy for $6.99, and edit in any text editor.
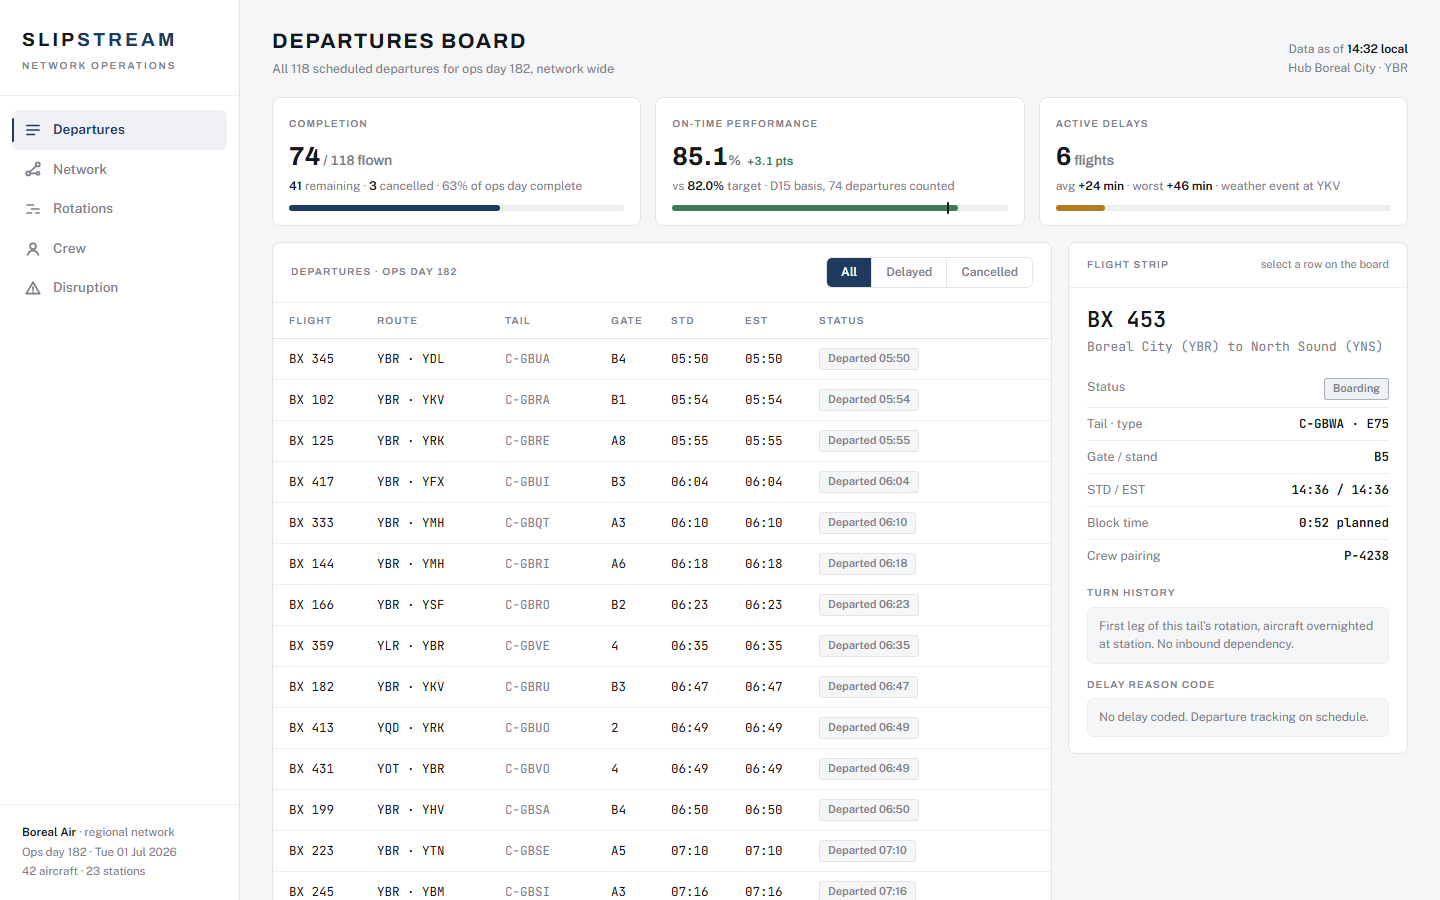
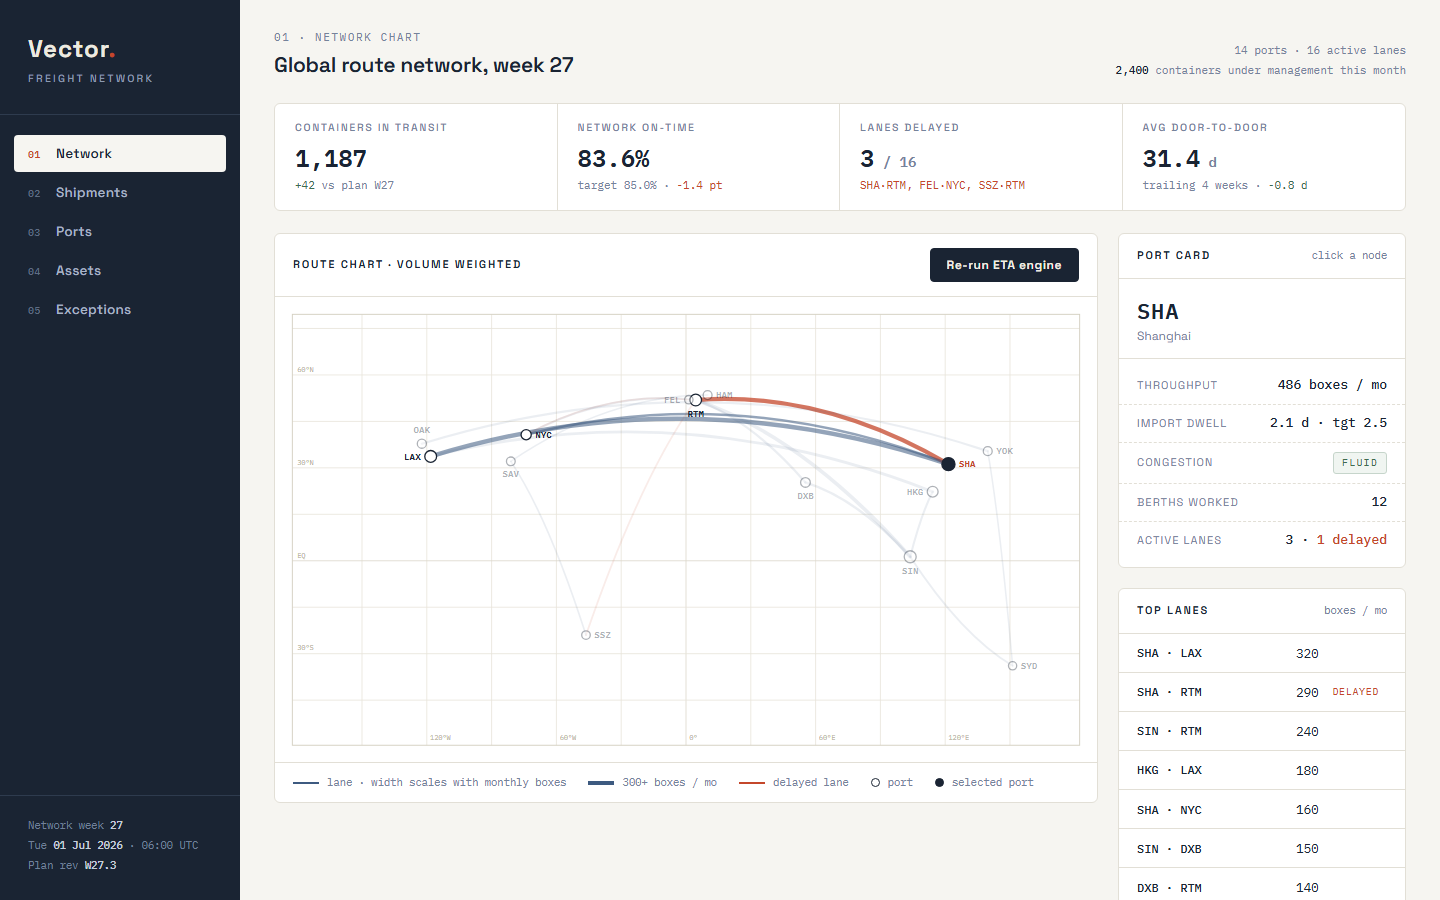
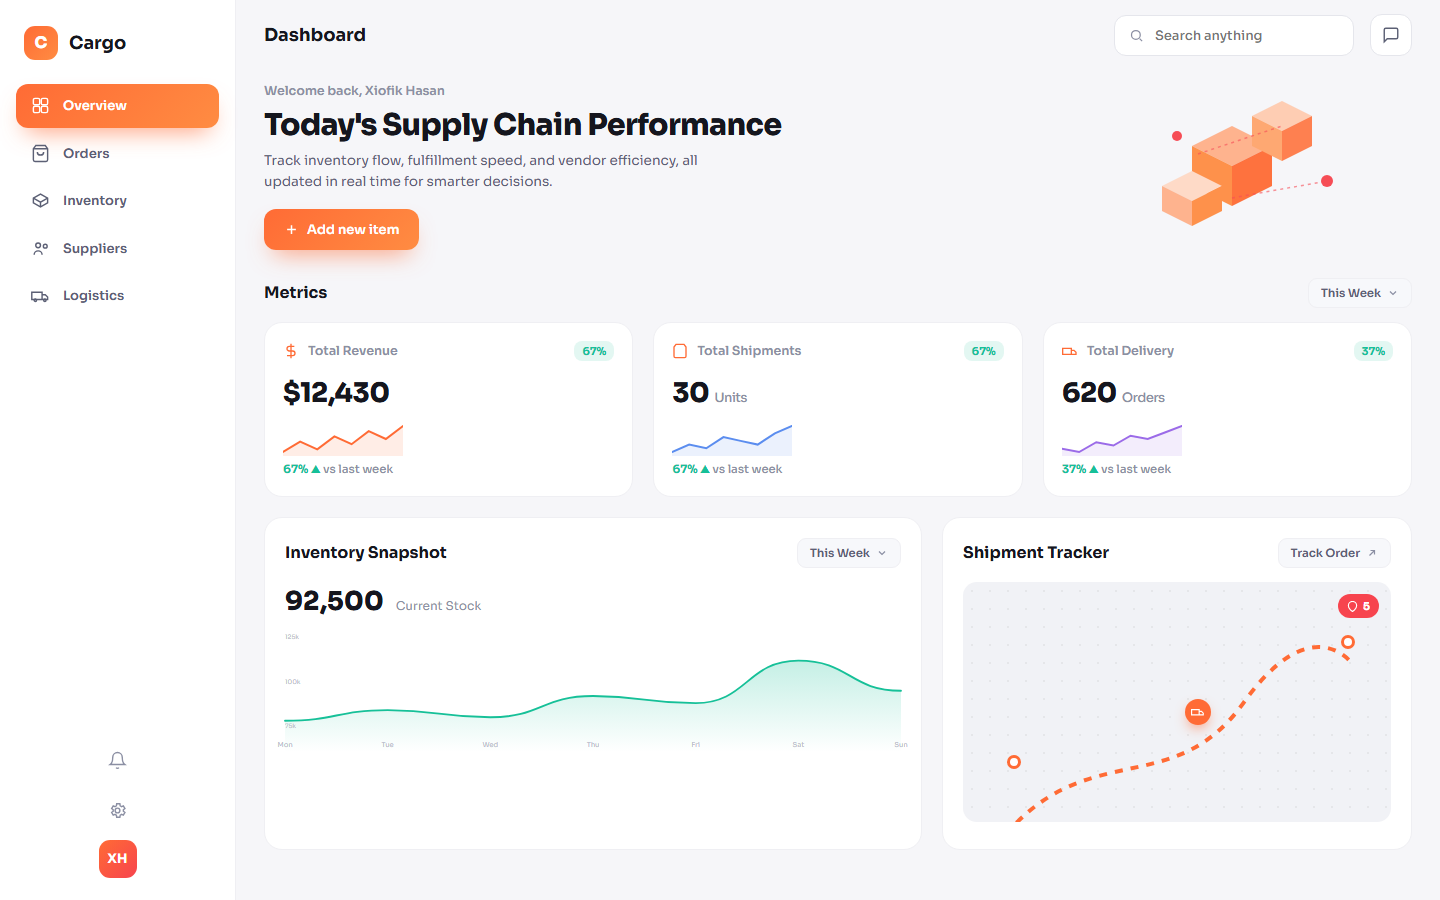
The 4 templates cover freight by sea, road, rail, and air. Vector is a freight network console: 1,187 containers in transit against plan, 3 of 16 lanes delayed, a container manifest with 6-step milestone chains, berth productivity in moves per hour, and a claims docket holding $147.9k in reserve. Trunkline is a rail operations desk with a Marey string diagram, punctuality against a 92.0% franchise target, and rolling stock mileage tracked against a 240,000 km overhaul threshold. Slipstream runs an airline ops day of 118 departures with a crew duty watchlist and a misconnect forecast, and Cargo Flow is a supply chain view for a small distributor: 92,500 units in stock, order and supplier tables, and a live shipment map.
Compare the logistics templates
| Template | Domain | Theme | Price |
|---|
| Trunkline | Rail, Transit ops | Timetable Paper | $6.99 |
| Slipstream | Aviation, Network ops | Porcelain Navy | $6.99 |
| Vector | Logistics, Freight network | Admiralty | $6.99 |
| Cargo Flow | Logistics, Supply chain | Amber | $6.99 |
Who uses these
A logistics dashboard serves 5 roles: network planners, logistics coordinators, port and station managers, fleet managers, and operations directors. Network planners read the KPI ribbon first, because the ribbon names which lanes are late before they touch the route chart. Logistics coordinators work the shipment manifest, watching milestone chains stall from gate-in to delivered. Port and station managers argue dwell and footfall down with days-on-terminal rankings and fault ledgers. Fleet managers watch idle days by depot and mileage since overhaul. An operations director gets the day in one pass: completion, the on-time delta in points, and the cost of disruption.
When to reach for one
A logistics template is the right pick when the network status lives in a spreadsheet of container statuses that someone emails every morning. A template gives every reader the same numbers in the same layout, from the same file. Pick it also when the visual language is the hard part: a Marey string diagram, a Beck-style network schematic, and an aircraft rotation Gantt are not charts a generic chart library ships, and these templates draw all 3 in working inline SVG. The numbers interlock the way real ops data does: the 3 delayed lanes in Vector's ribbon are the same lanes its delay ledger prices out. At $6.99 with a live preview, trying one costs less than one meeting spent reconciling two versions of the on-time figure. For the thinking behind these view choices, the guide to dashboard chart types covers when a Gantt or a Pareto beats a bar chart.
Frequently asked questions
What is a logistics dashboard template?
A logistics dashboard template is a pre-built HTML page that displays logistics metrics such as on-time performance, containers in transit, delay minutes by cause, dwell time, fleet utilization, and cost of delay. You download one file, replace the sample data with your own, and open it in a browser. No server, database, or build step is required.
What KPIs belong on a logistics dashboard?
A logistics dashboard tracks 6 KPI groups: on-time performance against target, transit volume against plan, delay minutes by cause, dwell or turnaround time, fleet utilization, and cost of delay. Vector carries the full set for container shipping, including a 31.4-day average door-to-door figure. Cargo Flow covers the smaller set a distributor needs: revenue, shipments, deliveries, and stock by warehouse.
Can I connect these templates to a tracking or EDI feed?
No, these templates do not connect to a tracking or EDI feed out of the box. Each template ships with coherent sample data in JavaScript arrays inside the file. To go live, replace the arrays with your own export or wire the file to your tracking API, and the views render from whatever the data layer returns.
Which logistics template should I start with?
Vector is the logistics template to start with if you run container freight, because it covers the full chain: network, shipments, ports, fleet assets, and exceptions. If you move passengers, Trunkline covers rail and Slipstream covers airline operations. If you run a small distribution business, Cargo Flow is the simplest of the 4.
 Dashboard
 $6.99
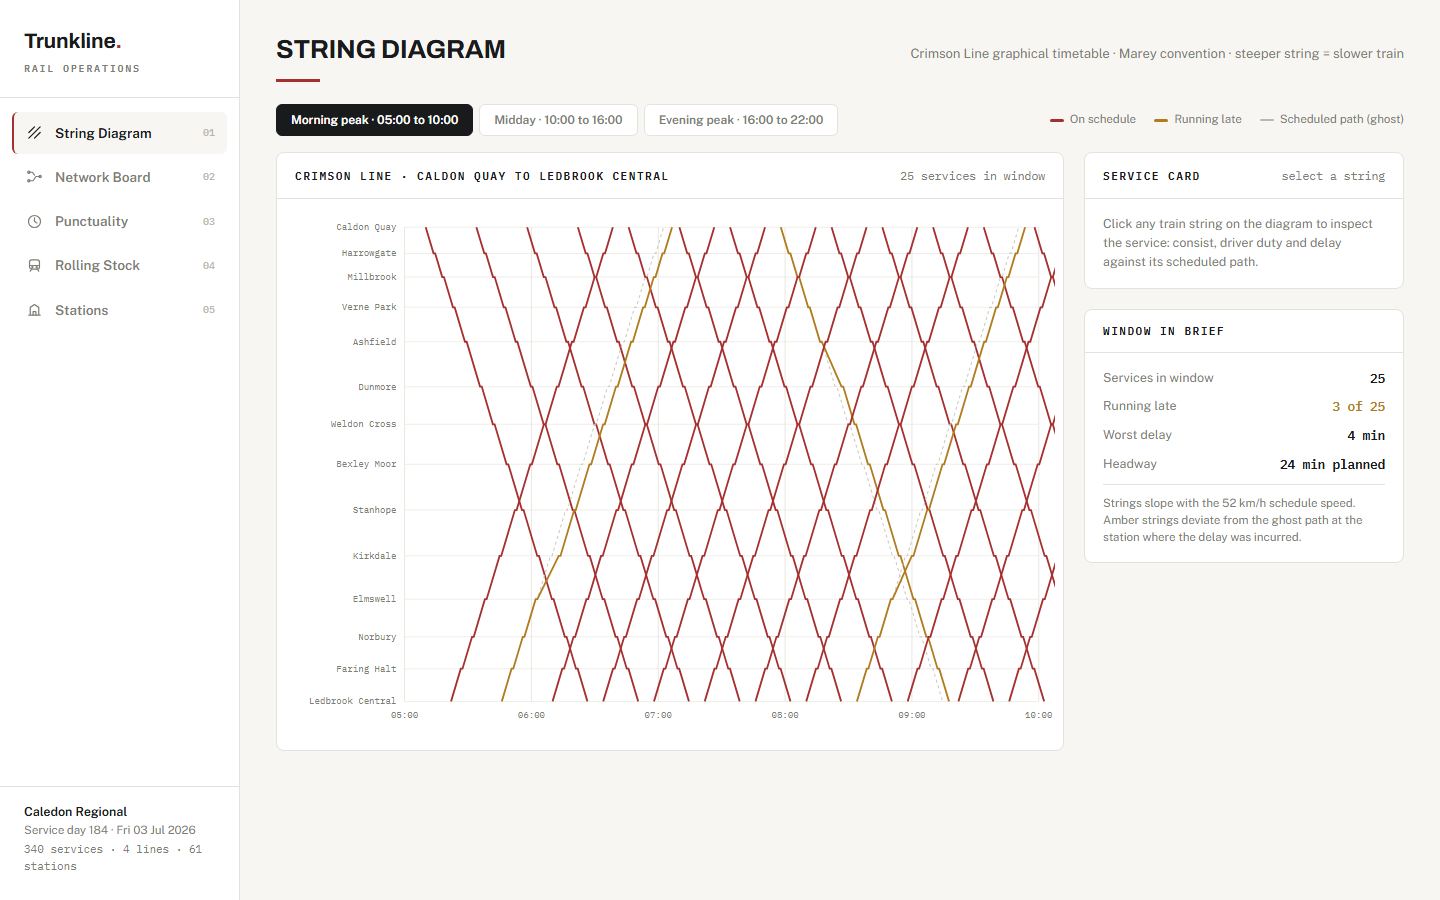
Trunkline is a single-file HTML dashboard template for rail operations, with a string diagram, network board, punctuality, rolling stock, and station views.
marey-convention string diagram for the Crimson Line with morning, midday, and evening window chipsghost scheduled paths and on-schedule versus running-late string colors, with a click-to-open service cardbeck-convention network schematic with 4 lines, interchange rings, and line isolation
Buy now · $6.99Live preview
$6.99
Trunkline is a single-file HTML dashboard template for rail operations, with a string diagram, network board, punctuality, rolling stock, and station views.
marey-convention string diagram for the Crimson Line with morning, midday, and evening window chipsghost scheduled paths and on-schedule versus running-late string colors, with a click-to-open service cardbeck-convention network schematic with 4 lines, interchange rings, and line isolation
Buy now · $6.99Live preview