Home › Templates › Hospitality
Category
Restaurant Dashboard Templates
A restaurant dashboard template is a single HTML file that renders a dinner service in a browser. The dinner service answers the expeditor's standing question: which tickets are running long, and what is left to sell. This page lists the restaurant category, where each template is a self-contained file you preview live, buy for $6.99, and edit in any text editor.
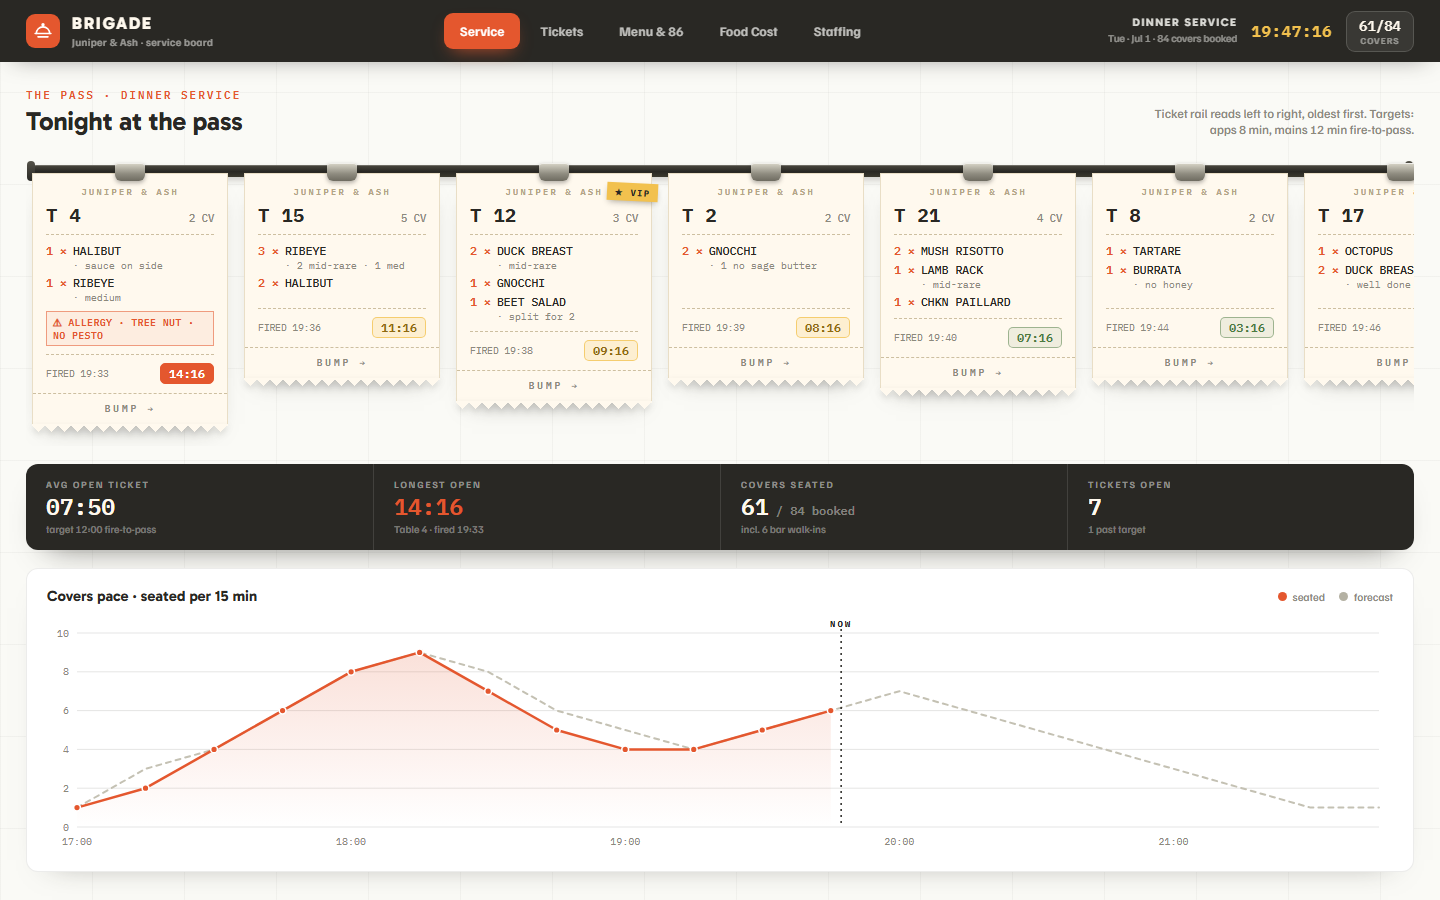
The category opens with Brigade, which models Juniper & Ash at 19:47 with 84 covers booked, 61 seated including 6 bar walk-ins, and 7 tickets open. Five tabs organize the operation from the pass to the tip pool. The Service tab centers on the ticket rail: 4 KPI chips track average open ticket against a 12:00 fire-to-pass target, and a histogram shows 57 closed tickets against the 8 to 12 minute target band. Station load bars read grill at 78%, sauté at 64%, garde manger at 41%, and pastry at 27%. The Menu & 86 tab carries a menu-mix quadrant over 28 days and an 86 board with 3 items down. The Food Cost tab charts COGS over 8 weeks against a 28% target beside $2,365.46 in open supplier invoices, and the Staffing tab holds the rota, a live labor percentage, and a tip pool split 60/25/15.
Compare the hospitality templates
| Template | Domain | Theme | Price |
|---|
| Brigade | Restaurant, Service ops | Flame | $6.99 |
Who uses these
A restaurant dashboard serves 4 roles: head chefs, expeditors, owners and general managers, and FOH managers. Head chefs watch the Service tab during service to decide when to pull someone off garnish to plate. Expeditors work the ticket rail and the closed-ticket log, which lists the last 8 bumped tickets with table, items, fire-to-pass time, expo initials, and minutes over target. Owners and general managers read the Food Cost tab weekly, where theoretical versus actual usage flags 5 ingredients with a likely-cause note for each gap. FOH managers use the covers pace chart, which plots seated covers per 15 minutes against the forecast, and close out the tip pool of 2,140 points worth $1,284.
When to reach for one
A restaurant template is the right pick when the pass runs on paper and a whiteboard and the food cost review is a spreadsheet rebuilt every Sunday. A template replaces the mental math of ticket timing with a distribution chart and per-station load counts, and the Food Cost tab already pairs usage variance with the invoice list, so the weekly review starts from the numbers. The file runs on a wall-mounted screen at the pass or a tablet on the expo station, with no point-of-sale license or BI tool required. Groups that also run lodging or a mountain venue can pair it with Portico or Cornice, and the financial KPI guide covers the COGS and labor math behind the cost tabs.
Frequently asked questions
What is a restaurant dashboard template?
A restaurant dashboard template is a pre-built HTML page that displays service metrics such as ticket times, station load, covers pace, food cost, and staffing. You download one file, replace the sample data with your own, and open it in any browser. No server, database, or build step is required.
Is Brigade a point-of-sale system?
No, Brigade is not a point-of-sale system. Brigade is a service data display that ships with realistic sample data for a dinner service, and it does not record orders. You swap in your own numbers by editing the single HTML file.
What does the Food Cost tab show?
The Food Cost tab shows a COGS chart for the trailing 8 weeks against a 28% target, an open supplier invoice list of $2,365.46, and a variance table for 5 ingredients comparing theoretical and actual usage with a likely-cause note for each gap.
Does the dashboard work on a kitchen display or tablet?
Yes, Brigade works on a kitchen display or tablet. The file runs in any modern browser on a wall-mounted screen at the pass or a tablet on the expo station. The layout is responsive, and the top banner keeps service stats visible while scrolling.
 Dashboard
 $6.99
Brigade is a single-file HTML dashboard that runs a restaurant dinner service: ticket times, station load, food cost, staffing, and the 86 board on one screen.
four live KPI chips: average open ticket vs a 12:00 target, longest open ticket, covers seated (61 of 84), and tickets open (7)covers pace chart plotting seated covers per 15 minutes against the booking forecastticket-time distribution histogram for 57 closed tickets against the 8 to 12 minute target band
Buy now · $6.99Live preview
$6.99
Brigade is a single-file HTML dashboard that runs a restaurant dinner service: ticket times, station load, food cost, staffing, and the 86 board on one screen.
four live KPI chips: average open ticket vs a 12:00 target, longest open ticket, covers seated (61 of 84), and tickets open (7)covers pace chart plotting seated covers per 15 minutes against the booking forecastticket-time distribution histogram for 57 closed tickets against the 8 to 12 minute target band
Buy now · $6.99Live preview