Home › Templates › Real Estate
Category
Real Estate Dashboard Templates
A real estate dashboard template is a single HTML file that shows what a property portfolio is leasing, collecting, and earning. Portfolio metrics include unit stages, occupancy, rent payments, tenant renewals, and net operating income. This page lists 1 real estate template, a self-contained file at $6.99 with a live preview and every chart drawn as inline SVG.
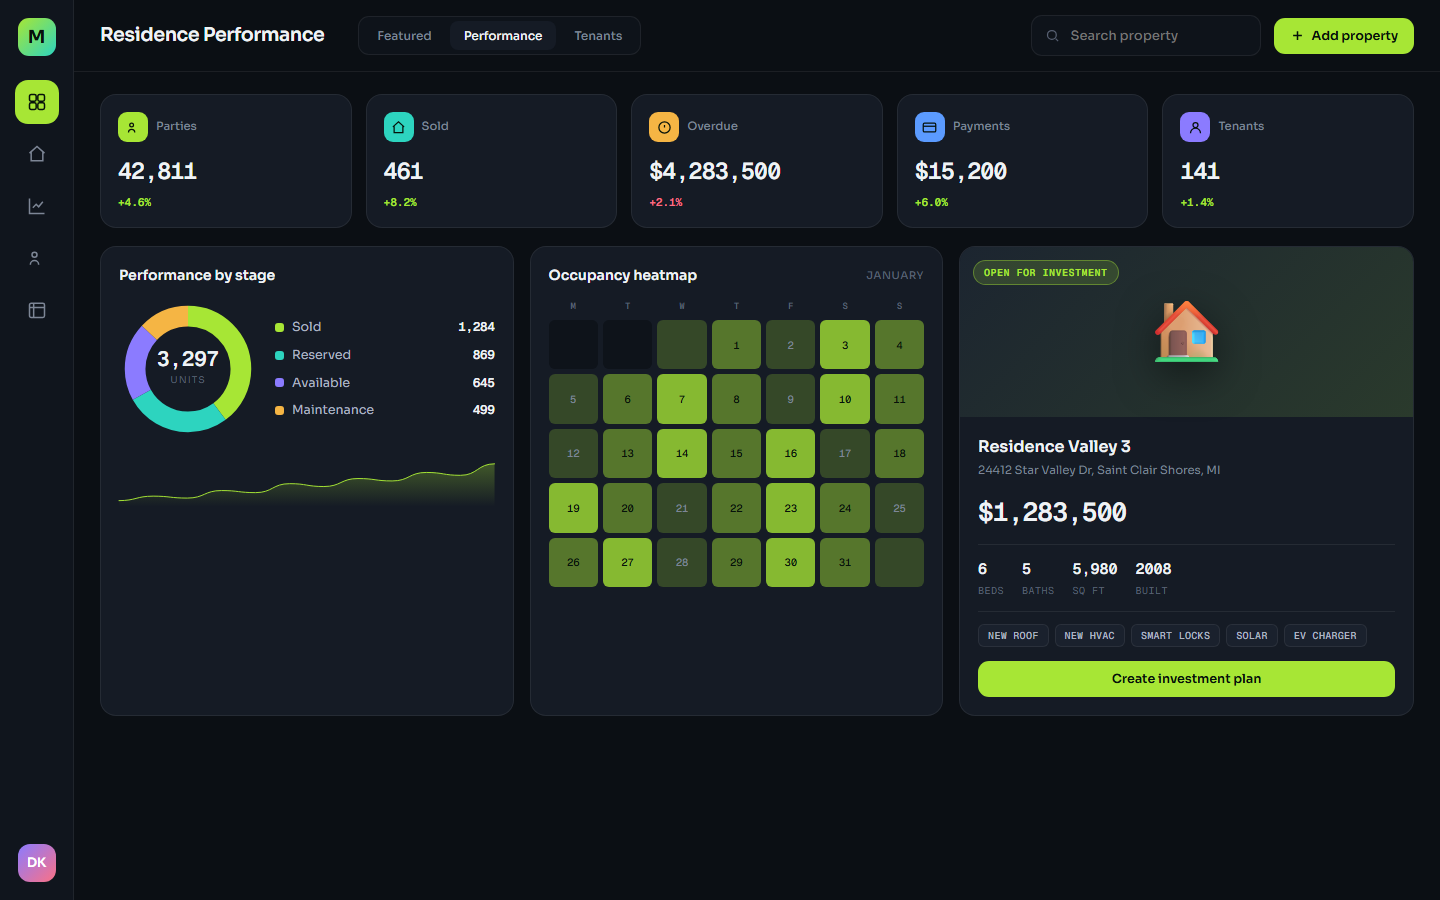
The template is Meridian Property, a dark operations dashboard for a portfolio of 5 residential properties totaling 3,297 units. Header counters track 461 sold units, $4,283,500 overdue, $15,200 payments this month, and 141 tenants, each with a week-over-week delta. A Performance by stage funnel splits the 3,297 units into 1,284 sold, 869 reserved, 645 available, and 499 in maintenance, next to a January occupancy heatmap. Three tables carry the daily work: All listings with price and occupancy per property, Recent payments with paid and overdue rows, and Tenants with lease end dates and renewal flags. A portfolio strip reports 7.4% gross yield, 94% occupancy, 28 average days listed, $2.1M NOI, and $48.2M portfolio value.
Compare the real estate templates
Who uses these
A real estate dashboard serves 4 audiences: portfolio managers, leasing agents, property accountants, and asset managers. Portfolio managers read the stage funnel against yield: 645 available units at 94% occupancy tells them whether to push leasing or hold pricing. Leasing agents work the All listings table, where Maple Grove 21 sits at 88% occupancy in Maintenance status while Harbor Lofts 4B is 100% and Listed, so showings go where units actually exist. Property accountants live in Recent payments, where Sam Cole's $1,980 on Harbor 4B is overdue against $15,200 collected this month. Asset managers use the net operating income panel, where Residence Valley 3 contributes $312k against Cedar Heights 7 at $118k, and operating expenses itemize maintenance at $184k, property tax at $142k, management at $96k, insurance at $58k, and utilities at $34k.
When to reach for one
A real estate template is the right choice when the rent roll is a spreadsheet one person updates and everyone else reads a week late. A dashboard file shows the same numbers to every reader in the same layout. Pick it also for investor-facing reporting: the featured property panel sells a specific asset, Residence Valley 3 at $1,283,500 with 6 beds, 5 baths, 5,980 square feet, and amenity tags from new roof to EV charger, plus a Create investment plan action. A small portfolio does not need a BI tool: 5 properties, 5 expense lines, and 3 tables fit in one HTML file. The guide on KPI card design explains why the header counters with deltas read the way they do, and finance dashboards cover the treasury side once the portfolio grows.
Frequently asked questions
What is a real estate dashboard template?
A real estate dashboard template is a pre-built HTML page that shows property portfolio metrics such as unit stages, occupancy, rent collection, overdue balances, tenant renewals, and net operating income. You download one file, replace the sample rent roll with your own figures, and open it in any browser.
What KPIs belong on a real estate dashboard?
A real estate dashboard tracks 7 KPI groups: units by stage, occupancy, payments collected, overdue balances, average days listed, gross yield, and net operating income. Meridian Property shows this full set plus a 5 line operating expenses breakdown and a January occupancy heatmap. Lease renewal dates are the first addition most landlords make.
Is the template tied to a property management system?
No, the template is not tied to any property management system. The properties, tenants, and payments are sample data inside the single HTML file. You replace the values with your own rent roll by editing the markup and script, with no API or database required to preview.
Can I add more than 5 properties?
Yes, you can add more than 5 properties. The listings, payments, and tenants tables render from arrays in the file's script, and the NOI and expense panels take plain values. Adding a property means adding rows and entries, not restructuring the layout.
 Dashboard
 $6.99
Meridian Property is a single-file HTML dashboard for a 5 property rental portfolio: unit stages, occupancy, payments, tenants, and net operating income.
header counters for 42,811 parties, 461 sold, $4,283,500 overdue, $15,200 payments, and 141 tenants, each with a percentage deltaperformance by stage funnel over 3,297 units: 1,284 sold, 869 reserved, 645 available, 499 in maintenancejanuary occupancy heatmap beside the stage funnel
Buy now · $6.99Live preview
$6.99
Meridian Property is a single-file HTML dashboard for a 5 property rental portfolio: unit stages, occupancy, payments, tenants, and net operating income.
header counters for 42,811 parties, 461 sold, $4,283,500 overdue, $15,200 payments, and 141 tenants, each with a percentage deltaperformance by stage funnel over 3,297 units: 1,284 sold, 869 reserved, 645 available, 499 in maintenancejanuary occupancy heatmap beside the stage funnel
Buy now · $6.99Live preview