Home › Templates › Library
Category
Library Dashboard Templates
A library dashboard template is a single HTML file that renders circulation, collections, holds, and program metrics for a library system in a browser. These metrics answer the questions a head librarian asks every morning: what circulated, which shelves earn their space, how long the holds queue runs, and which programs filled their rooms. This page lists one library template, a self-contained file you preview live, download free, and edit in any text editor.
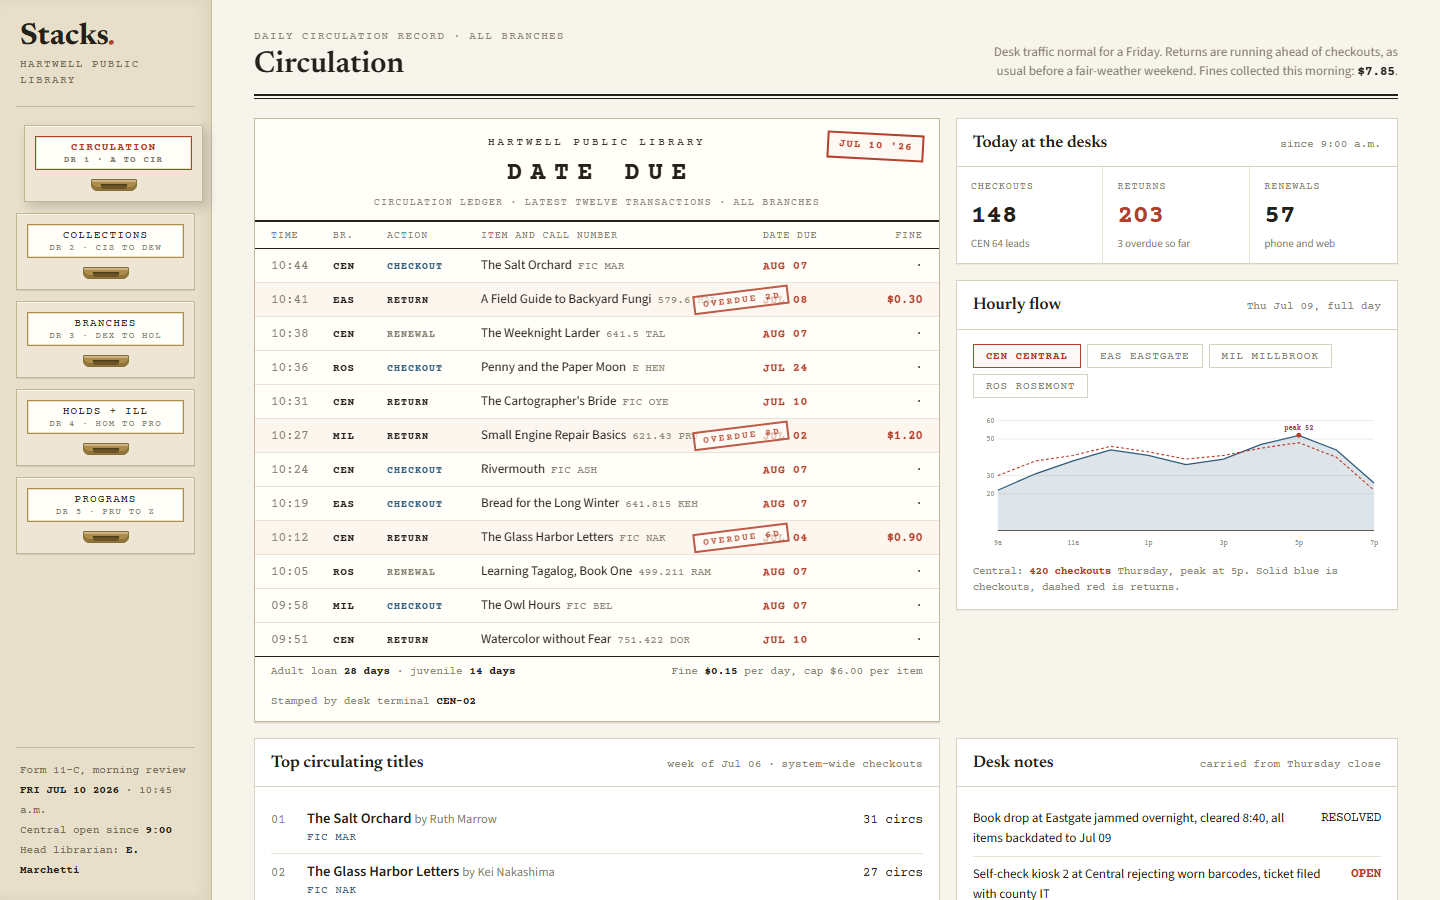
The template is Stacks, which models Hartwell Public Library, a four-branch system with Central, Eastgate, Millbrook, and Rosemont locations. Stacks opens on the morning review: a ledger of the latest twelve circulation transactions, hourly desk flow against the previous day, and the week's top circulating titles. The collections census counts 96,450 volumes system-wide, with 63,600 in adult nonfiction, and draws annual turnover per Dewey hundred against a 1.0 target per class. A weeding table flags candidates by CREW rule, the holds queue triggers acquisitions at 4 holds per copy, and the programs calendar shows attendance against room capacity.
Compare the library templates
| Template | Domain | Theme | Price |
|---|
| Stacks | Public library, Circulation | Paper Stamp | Free |
Who uses these
A library dashboard serves 5 roles: head librarians, collection development librarians, branch managers, circulation supervisors, and program coordinators. Head librarians read the morning review before the doors open, including the desk notes carried forward from the previous close. Collection development librarians watch Dewey-class turnover and the weeding quota, which stands at 61 of 150 titles pulled for July. Branch managers compare door counts across the four locations against the July weekday average of 862. Circulation supervisors track the holds queue and the interlibrary loan ledger, where the courier runs Tuesday and Friday. Program coordinators monitor registration against capacity and today's room bookings.
When to reach for one
A library template is the right pick when the morning review is a clipboard, a spreadsheet, and an ILS report printed at the front desk. The template puts circulation, collections, and programs on one page that reads like the paper form it replaces. Pick it also for grant and board reporting, because the holdings census, turnover figures, and program attendance already sit in the format a funding report asks for. Stacks is free in the catalog, so a branch can pilot the format with its own numbers before committing staff time to a full ILS dashboard module. The file is plain HTML, and the guide on customizing an HTML dashboard template covers swapping the sample data.
Frequently asked questions
What is a library dashboard template?
A library dashboard template is a pre-built HTML page that displays library metrics such as circulation transactions, collection turnover, holds queues, and program attendance. You download one file, replace the sample data with your own figures, and open it in any browser. No server, database, or ILS license is required.
Is there a free library dashboard template?
Yes, Stacks is a free library dashboard template that renders the full morning review for a four-branch system: a twelve-transaction circulation ledger, a holdings census of 96,450 volumes, shelf-by-shelf turnover, and a holds queue with an acquisitions trigger at 4 holds per copy. It uses the same single-file structure as the paid templates.
What metrics belong on a library dashboard?
A library dashboard tracks 6 metric groups: circulation transactions, desk traffic, collection turnover by Dewey class, weeding progress, holds and interlibrary loans, and program attendance. Stacks shows this full set, including annual turnover against a 1.0 target per class and branch door counts against the July weekday average of 862.
Can I connect a library dashboard to our ILS?
Yes, you can connect a library dashboard to your ILS with a contained scripting task. The shipped file stores its sample data in a script block inside the page. Pointing the sections at a real export means replacing those constants with a fetch of your JSON or CSV, after which the tables and charts render as before.
 Dashboard
 Free
New
Stacks is a single-file HTML dashboard template that tracks circulation, collections, branches, holds, and programs for a four-branch public library system.
circulation ledger of the latest twelve transactions with time, branch, action, call number, due date, and finehourly desk flow charted against the previous full dayholdings census of 96,450 volumes with adult nonfiction broken down by Dewey hundreds
Download freeLive preview
Free
New
Stacks is a single-file HTML dashboard template that tracks circulation, collections, branches, holds, and programs for a four-branch public library system.
circulation ledger of the latest twelve transactions with time, branch, action, call number, due date, and finehourly desk flow charted against the previous full dayholdings census of 96,450 volumes with adult nonfiction broken down by Dewey hundreds
Download freeLive preview