Home › Templates › Education
Category
School Dashboard Templates
A school dashboard template is a single HTML file that shows attendance, staff coverage, gradebook health, and facilities on one page. School metrics tell a principal what happened by the time attendance posts and what needs action before the term ends. This page lists 1 school template, a self-contained file at $6.99 with a live preview.
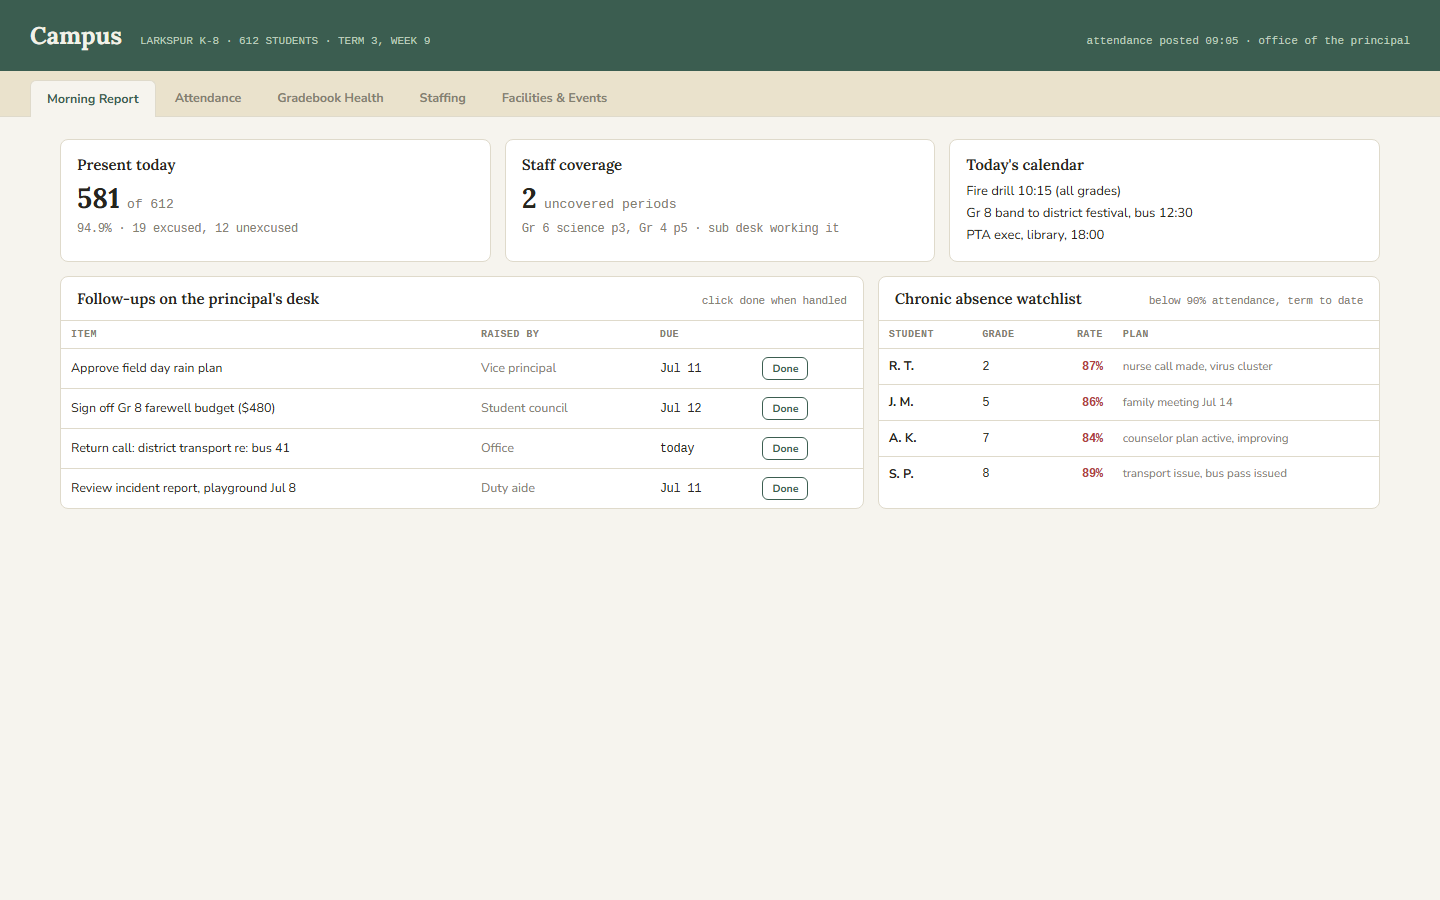
Campus models a K-8 school with 612 students in term 3, week 9, attendance posted at 09:05. The report leads with 581 present at 94.9 percent, split into 19 excused and 12 unexcused, and flags 2 uncovered class periods with the sub desk working them. An attendance heatmap draws one row per grade and one cell per day, and the term trend charts the weekly rate against a 96 percent district target, cleared 7 of 9 weeks. Gradebook health lists every class with days since the last posted assessment, flags 14 students needing intervention down from 19 at mid-term, and counts blockers before report cards generate on July 18. Staffing covers a six-week substitute fill rate and a professional development budget of $4,150 remaining of $12,000. Facilities lists work orders by priority and age, with today's room bookings and a term events runway.
Compare the education templates
| Template | Domain | Theme | Price |
|---|
| Campus | Education, School administration | Slate Manila | $6.99 |
Who uses these
A school dashboard serves 5 roles: principals, assistant principals, office managers, counselors, and facilities coordinators. Principals read the morning report after attendance posts and decide what lands on their desk first. Assistant principals manage the chronic absence watchlist of students below 90 percent attendance. Office managers run the sub desk, track fill rate, and watch the professional development budget. Counselors monitor the intervention list split into improving, flat, and slipping. Facilities coordinators work the work-order queue and coordinate room bookings and term events.
When to reach for one
A school template is the right pick when the morning report is a PA announcement, a paper attendance sheet, and three spreadsheets. A template consolidates attendance, coverage, gradebooks, and facilities into one page posted at 09:05. Pick it also when the school reports to a district: the term trend against the 96 percent target and the excused-versus-unexcused split are already in the format an attendance review asks for. Small districts that cannot justify a BI license per school get the same page from one file per school, fed from the student information system export. For a free adjacent example, Stacks runs the same single-file model for a public library, and the guide on what a dashboard is covers the shared format.
Frequently asked questions
What is a school dashboard template?
A school dashboard template is a pre-built HTML page that displays school metrics such as attendance, staff coverage, gradebook currency, intervention lists, and facilities work orders. You download one file, replace the sample data with your school's figures, and open it in any browser.
What KPIs belong on a school dashboard?
A school dashboard tracks 7 KPI groups: daily attendance, excused versus unexcused absences, chronic absence, substitute fill rate, gradebook currency, intervention counts, and budget remaining. Campus shows this full set plus facilities work orders and a report card blocker count ahead of the generation date.
Is Campus suited to high schools or only K-8?
Yes, Campus is suited to high schools as well as K-8. The sample school is a K-8 with 612 students, but the structure is generic: grades, periods, classes, and events are data rows. A high school edits the grade rows, calendar, and staffing sections to match its own schedule.
Can Campus use data from our student information system?
Yes, Campus can use data from your student information system with a contained scripting change. The shipped file renders sample data embedded in the page. Feeding it from an SIS export means replacing the embedded constants with your JSON or CSV, which leaves the heatmap, trend chart, and tables intact.
 Dashboard
 $6.99
New
Campus is a single-file HTML dashboard template that tracks attendance, gradebook health, staffing, and facilities for a K-8 school.
presence KPI of 581 of 612 students at 94.9 percent, split into 19 excused and 12 unexcused absencesstaff coverage callout flagging 2 uncovered periods with the sub desk statusattendance heatmap with one row per grade and one cell per day, hover for the count
Buy now · $6.99Live preview
$6.99
New
Campus is a single-file HTML dashboard template that tracks attendance, gradebook health, staffing, and facilities for a K-8 school.
presence KPI of 581 of 612 students at 94.9 percent, split into 19 excused and 12 unexcused absencesstaff coverage callout flagging 2 uncovered periods with the sub desk statusattendance heatmap with one row per grade and one cell per day, hover for the count
Buy now · $6.99Live preview